Gold prices fell to $4,491 an ounce this week, breaking below all short and mid-term exponential moving averages after five months in a declining channel. The metal traded just above its 200-day EMA at $4,366 despite a 6.83% monthly drop, though it's still up 36% from this time last year.
Descending Channel Breakdown
Since January 2026, gold has been confined within a downward-sloping channel. Last week's price action snapped the short-term trendline support. The $4,491 level now sits beneath the 20-day, 50-day, and 100-day EMAs simultaneously. Only the longer 200-day EMA at $4,366 offers remaining technical support.
Commercial versus Speculator Bets
Commercial hedgers added 10,818 short contracts in the week ending May 12. Their bearish positions now make up 71.2% of total open interest. Non-commercial speculators countered by adding 7,979 long contracts during the same period. This sharp divergence reveals fundamental disagreement between market participants.
GLD Options Show Rising Pessimism
The SPDR Gold Trust (GLD) put-call ratio climbed to 0.58 by open interest as of May 19. That's up from 0.47 in February, reflecting accelerating put option accumulation. More puts than calls signal growing bearish sentiment among options traders.
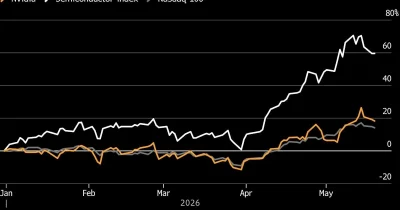
Oil Surges While Gold Stalls
Despite surging oil prices—WTI Crude Oil up 60% and Brent Crude up 50% since the start of Iran-related conflicts—gold hasn't gained similar momentum. The metal's recent 6.83% monthly decline occurs even as geopolitical tensions drive energy prices higher. This divergence puzzles some market observers.
Traders now watch whether gold will hold above the 200-day EMA at $4,366 as the next critical support level.