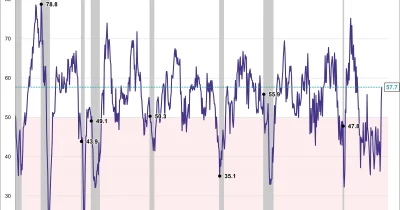
The so-called Warren Buffett Indicator — a measure of total U.S. stock market value relative to gross domestic product — hit 236% in May 2026, blowing past the levels seen during the dot-com bubble. The previous record range of 145% to 159% was set in the late 1990s and early 2000s, making the current reading roughly 50% higher than that era's peak.
What the indicator measures
The ratio, named after Berkshire Hathaway's CEO who once called it 'the best single measure of where valuations stand at any given moment,' compares the total market capitalization of all publicly traded U.S. stocks to the country's quarterly GDP. A reading above 100% is generally considered overvalued. At 236%, the metric suggests the stock market is worth more than double the economic output of the entire nation.
Why the dot-com comparison matters
During the dot-com bubble, the indicator peaked near 159% before the Nasdaq collapsed roughly 78% from its 2000 high. The current level of 236% is not only a new record but also far exceeds any previous extreme. The indicator's climb has been fueled by a sustained rally in large-cap technology stocks, low interest rates for most of the post-COVID period, and a surge in corporate earnings that has lifted equity prices faster than GDP growth.
What the reading doesn't say
The Buffett Indicator is a blunt tool. It doesn't account for changes in how businesses are structured — for instance, many modern companies earn a significant portion of revenue overseas, which can inflate U.S. market cap relative to domestic GDP. It also ignores the effect of low interest rates, which can justify higher valuations by making future earnings more valuable today. Still, the sheer size of the gap between the current reading and historical norms has drawn attention from investors who worry the market may be priced for perfection.
Unresolved question
No one knows whether the indicator will revert toward its long-term average through a market decline, a surge in GDP, or some combination of both. The next update to the ratio will come with the release of second-quarter GDP data in late July. Until then, traders and analysts will have to sit with a number that has no precedent.