The AltSeason Index has climbed to 28.6 this week, marking a notable shift from Bitcoin season into altcoin rotation. Data from CryptoQuant shows altcoin volume — excluding the top five assets by market cap — accelerating on centralized exchanges, a sign of broad-based participation rather than just a few tokens moving.
AltSeason Index: Reading the move
The index measures whether altcoins are outperforming Bitcoin over a 90-day window. At 28.6, it's still far from the elevated readings that defined genuine altseasons in prior cycles. Its peak in early 2024 was modest by historical standards. But the direction is what traders are watching: the index has been trending up since the start of May, and the volume data backs it up.
CryptoQuant's analysis points to real accumulation happening under the hood. Altcoin trading volumes on centralized exchanges are rising, and the mix of assets traded is widening. That suggests money isn't just rotating into memes or layer-1s — it's spreading across the board.
Ethereum's converging story
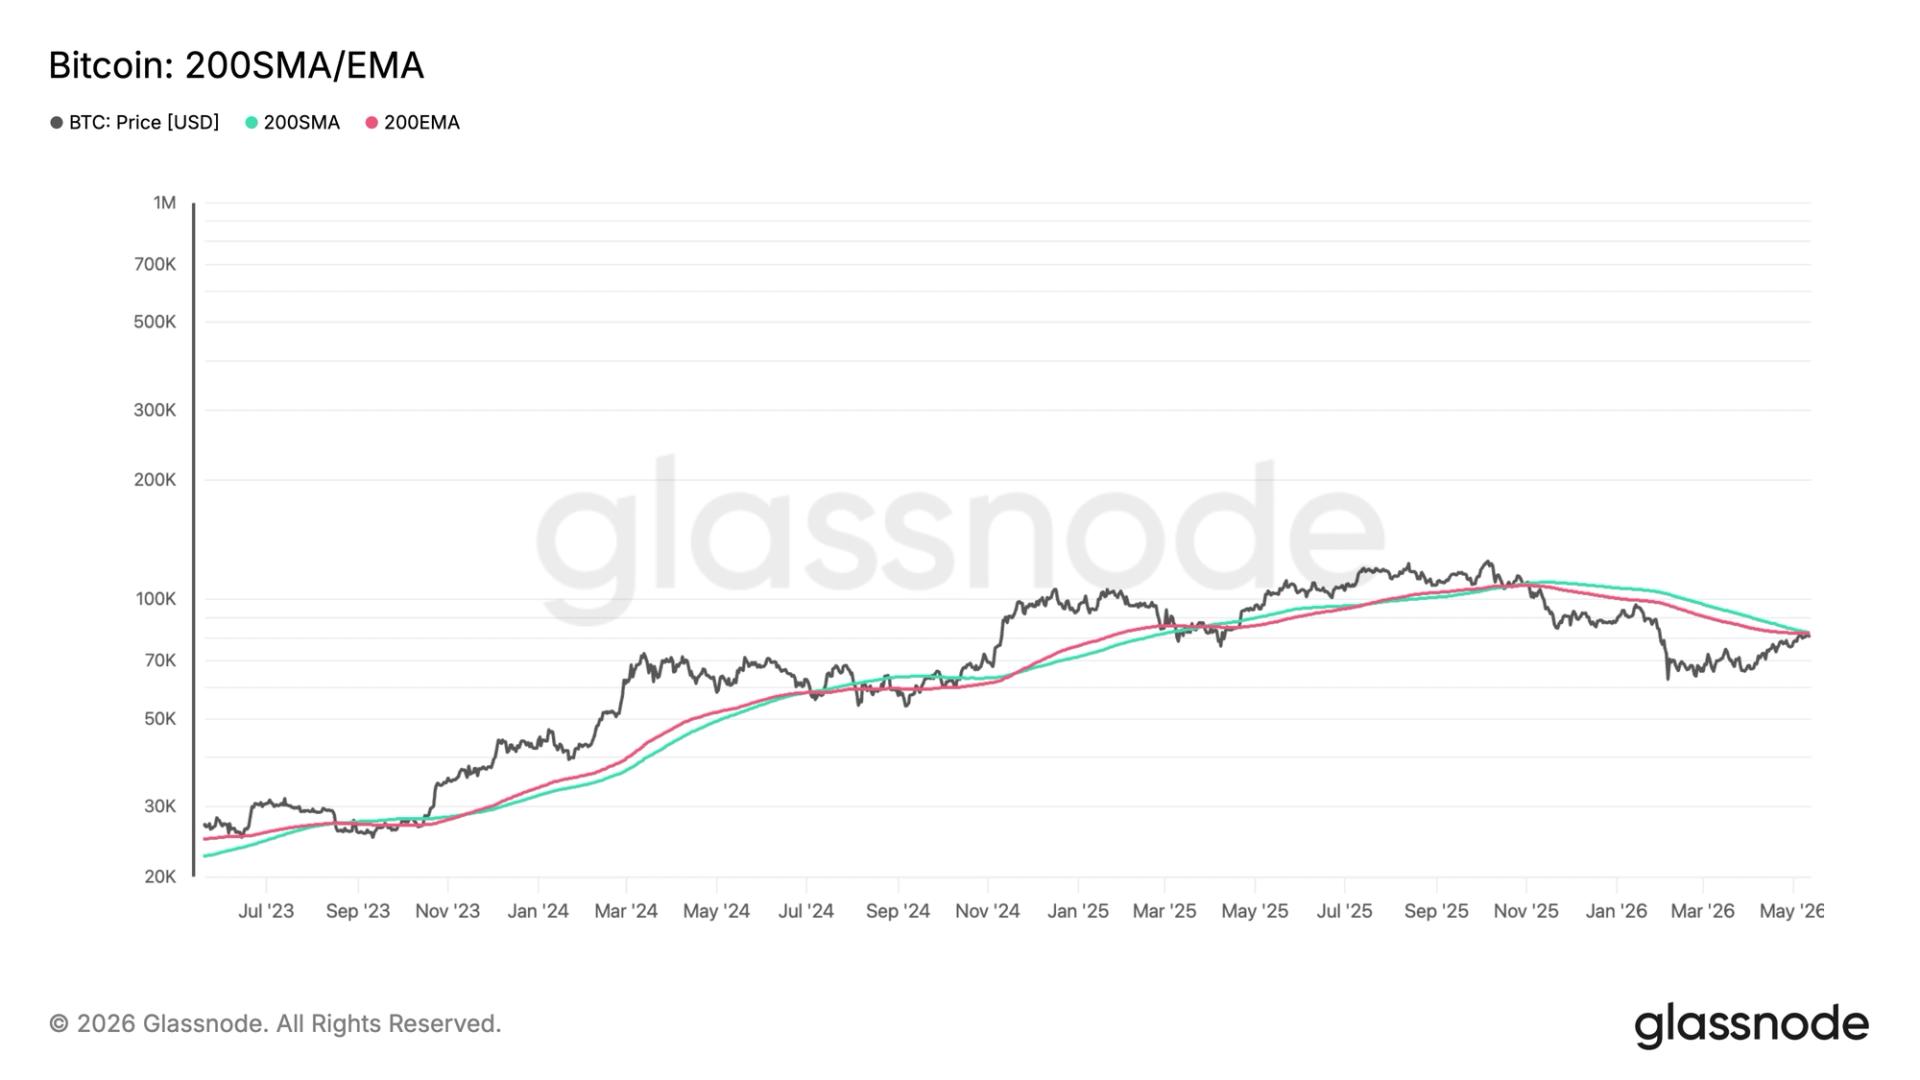
Ethereum has a nine-year technical convergence approaching resolution, according to the data. That pattern, which combines multiple moving averages and cycle indicators, has historically preceded meaningful moves in ETH. With ETH hovering near the 200-week moving average — a historical long-term pivot for altcoin cycles — the setup is drawing attention.
It's not a breakout yet. But the convergence is tightening, and the clock is ticking.
Market cap recovery: The $220B line
Total crypto market cap excluding the top 10 assets is trying to stabilize in the $190–$200 billion range after a corrective phase earlier this year. That correction included a capitulation spike in selling volume — followed by declining participation during the recovery. That pattern usually means reduced selling pressure, not a flood of new buyers.
To confirm a higher high on the altcoin market cap chart, the market needs a clean break above the $220–$240 billion region. Right now, price is holding around the 200-week moving average and has reclaimed its short-term moving average. It's testing the 100-week moving average as resistance.
The recovery from the early 2026 lows has been steady but slow. The absence of a volume surge during the bounce tells you this is still a repair job, not a euphoric sprint.
What to watch next
For the rotation to mature into a full altseason, the market cap ex-top-10 needs to push decisively above that $220 billion threshold. Until then, the AltSeason Index reading is a signal worth respecting — but not yet a confirmation.