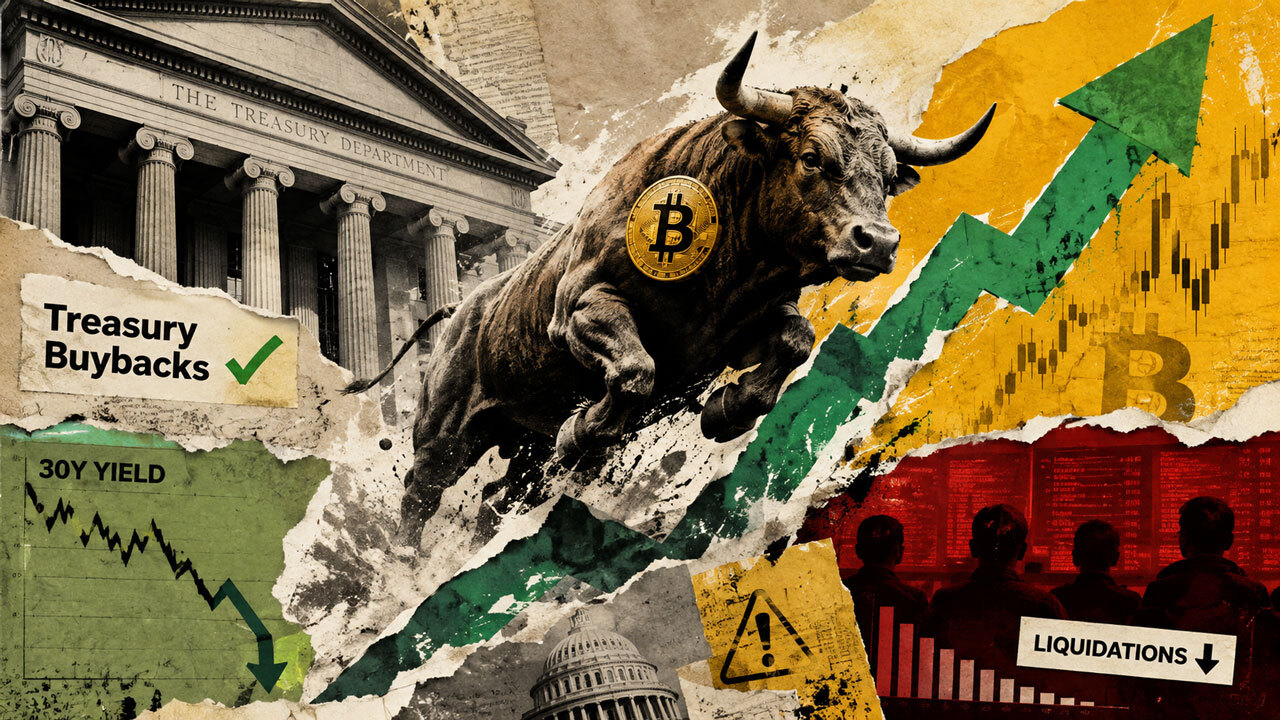
Bitcoin's funding rate just hit a 20-month high, a signal that leveraged longs are crowding into the market at levels last seen in January 2025, when BTC traded near $102,198 and soon rolled over. With the price now hovering around $64,300, traders are watching whether the same dynamic plays out again. The rate spike, combined with a retail-heavy positioning skew, suggests the next move may not be up.
A 20-month high in funding
Funding rates are the periodic payments between long and short traders on perpetual futures, and they tend to run hot when the market is over-leveraged in one direction. The current reading is the highest since January 2025, a period that preceded a sharp correction. Back then, Bitcoin was trading near $102,198 before the price turned lower.
This time, the setup is different in one key way: the price is far lower, and the move higher since August 16 has been modest, just 3.41%. Yet long positions have actually fallen during that climb. That points to deliberate profit-taking rather than forced liquidations, which is a healthier sign but still leaves the market exposed if sentiment flips.
Retail is driving the trade
The positioning data makes it clear who is pushing this. The retail long/short ratio spiked to 2.22 on August 17, while the whale ratio sat at 1.47. That gap means smaller traders are far more bullish than the big players, a divergence that often ends with retail getting caught on the wrong side.
Whales aren't as eager to add risk, and their relative caution is worth noting. When retail and whale positioning diverge this sharply, the market tends to resolve in favor of the larger players.
The chart says $57,894
Technicians are watching a head and shoulders pattern that has been forming since July 13. The neckline sits near $61,763, and a daily close below that level would confirm a breakdown with a measured target of $57,894, roughly 6.5% below current prices.
To cool the setup, Bitcoin needs a daily close above $65,419. A move above $66,922 would cancel the pattern entirely. Neither level has been tested this week, and with rising Iran oil tension and fading buying volume capping upside momentum, the path of least resistance looks lower.
What could reset the setup
It's not all bearish. Spot demand and steady ETF inflows can build a floor under the price, and a funding rate that flips negative would mark a reset, clearing out the excess leverage and letting patient buyers step in at better levels.
The timing isn't great for bulls. Funding is hot, retail is long, and the chart pattern is pointing down. The next concrete signal to watch is a daily close below $61,763, which would open the door to $57,894. Until then, the market is stuck between a crowded trade and a technical breakdown that hasn't confirmed yet.