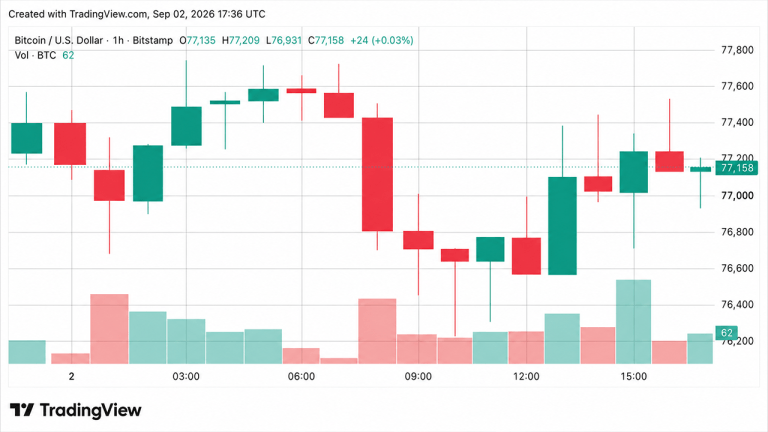
Bitcoin is trading around $73,000 this week, but some analysts are warning the next move could be down to $65,000. The catch: the current market structure looks different from the pattern that preceded Bitcoin's February breakdown — and that difference matters for traders trying to gauge what comes next.
Why the February comparison doesn't fit
In February, Bitcoin's price action followed a specific technical setup that eventually gave way to a sharp decline. This time around, the structure isn't repeating that same pattern. Analysts point out that the consolidation zone, volume profile, and order-book dynamics are all distinct from what they saw two months ago. That doesn't mean a drop is off the table — just that the old playbook won't work.
Where the $65,000 target comes from
The downside risk to $65,000 isn't pulled from thin air. It's based on a combination of support levels that have held during previous pullbacks and the current range's lower boundary. If Bitcoin loses its grip on $73,000, the next major support cluster sits near $65,000. That's a roughly 11% drop from here — painful but not unprecedented in a choppy market.
What traders are watching now
The key question is whether Bitcoin can defend $73,000 in the coming days. Volume has been below average, which can amplify moves in either direction. A break below $70,000 would likely accelerate selling toward $65,000. Conversely, a push above recent resistance near $75,000 could invalidate the bearish case. For now, the market is in a waiting game — and the structural differences from February mean no one's sure which way it breaks.
One thing is clear: the next few sessions will either confirm the downside risk or prove the analysts wrong. No one's calling a crash, but the $65,000 number is on everyone's radar.