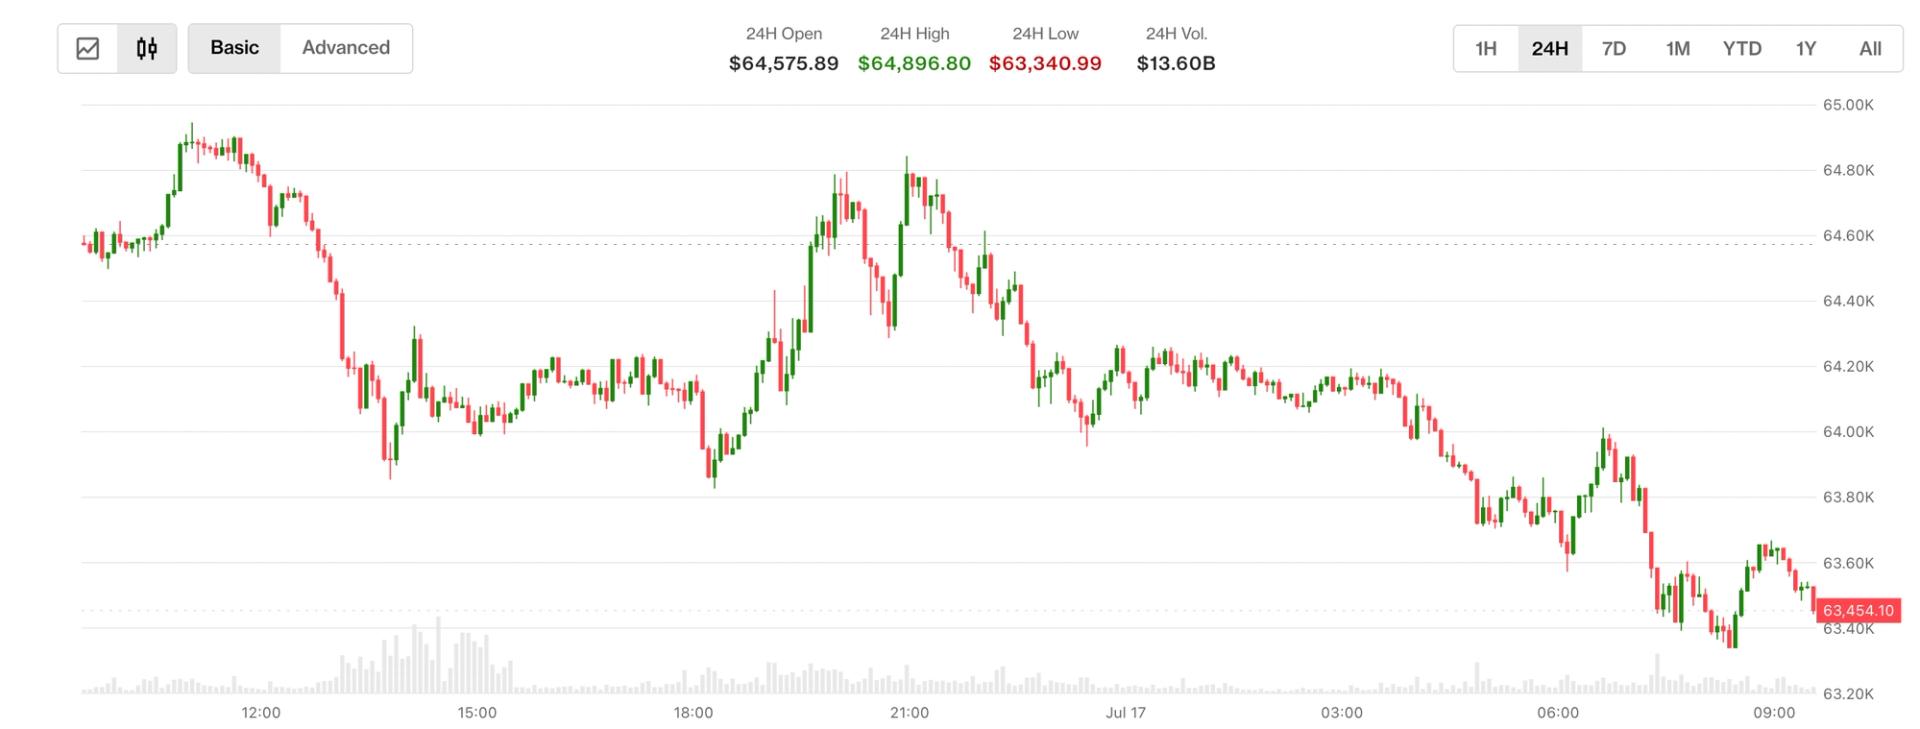
Bitcoin's price action this week is being shaped by liquidity clusters and futures market positioning, with liquidation heatmap data offering traders a roadmap for where BTC might head next. The dynamics suggest a market propped up by leveraged longs, but with potential volatility ahead as key levels are tested.
Liquidity clusters as price magnets
Liquidity clusters — zones where large numbers of orders sit — are acting as magnets for Bitcoin's price. These clusters form around areas where many traders have placed stop-losses or take-profits, and the market tends to sweep through them before reversing. Right now, the data shows a dense cluster just above current price, which could draw BTC higher before a potential pullback.
Futures traders in the driver's seat
Futures traders are propping up the current move. Open interest has climbed alongside price, a sign that new money is entering via leveraged positions rather than spot buying. That makes the rally fragile — if funding rates turn negative or a large long gets liquidated, the whole structure could unwind quickly. The timing isn't great for a sudden flush, but that's exactly when liquidity clusters become dangerous.
What the liquidation heatmap shows
Liquidation heatmap data provides hints on where BTC price may go next. The heatmap highlights a thick band of long liquidations around $58,000, meaning if price drops there, a cascade could follow. Conversely, a thin layer of short liquidations sits near $62,000, suggesting less resistance to the upside. Traders are watching these levels closely — a break above $62,000 could trigger a short squeeze, while a dip to $58,000 might bring the bears out.
None of this guarantees direction, but the map is clear about where the pain points are. For now, the market is being held up by futures money, and the next move depends on whether that support holds or cracks.