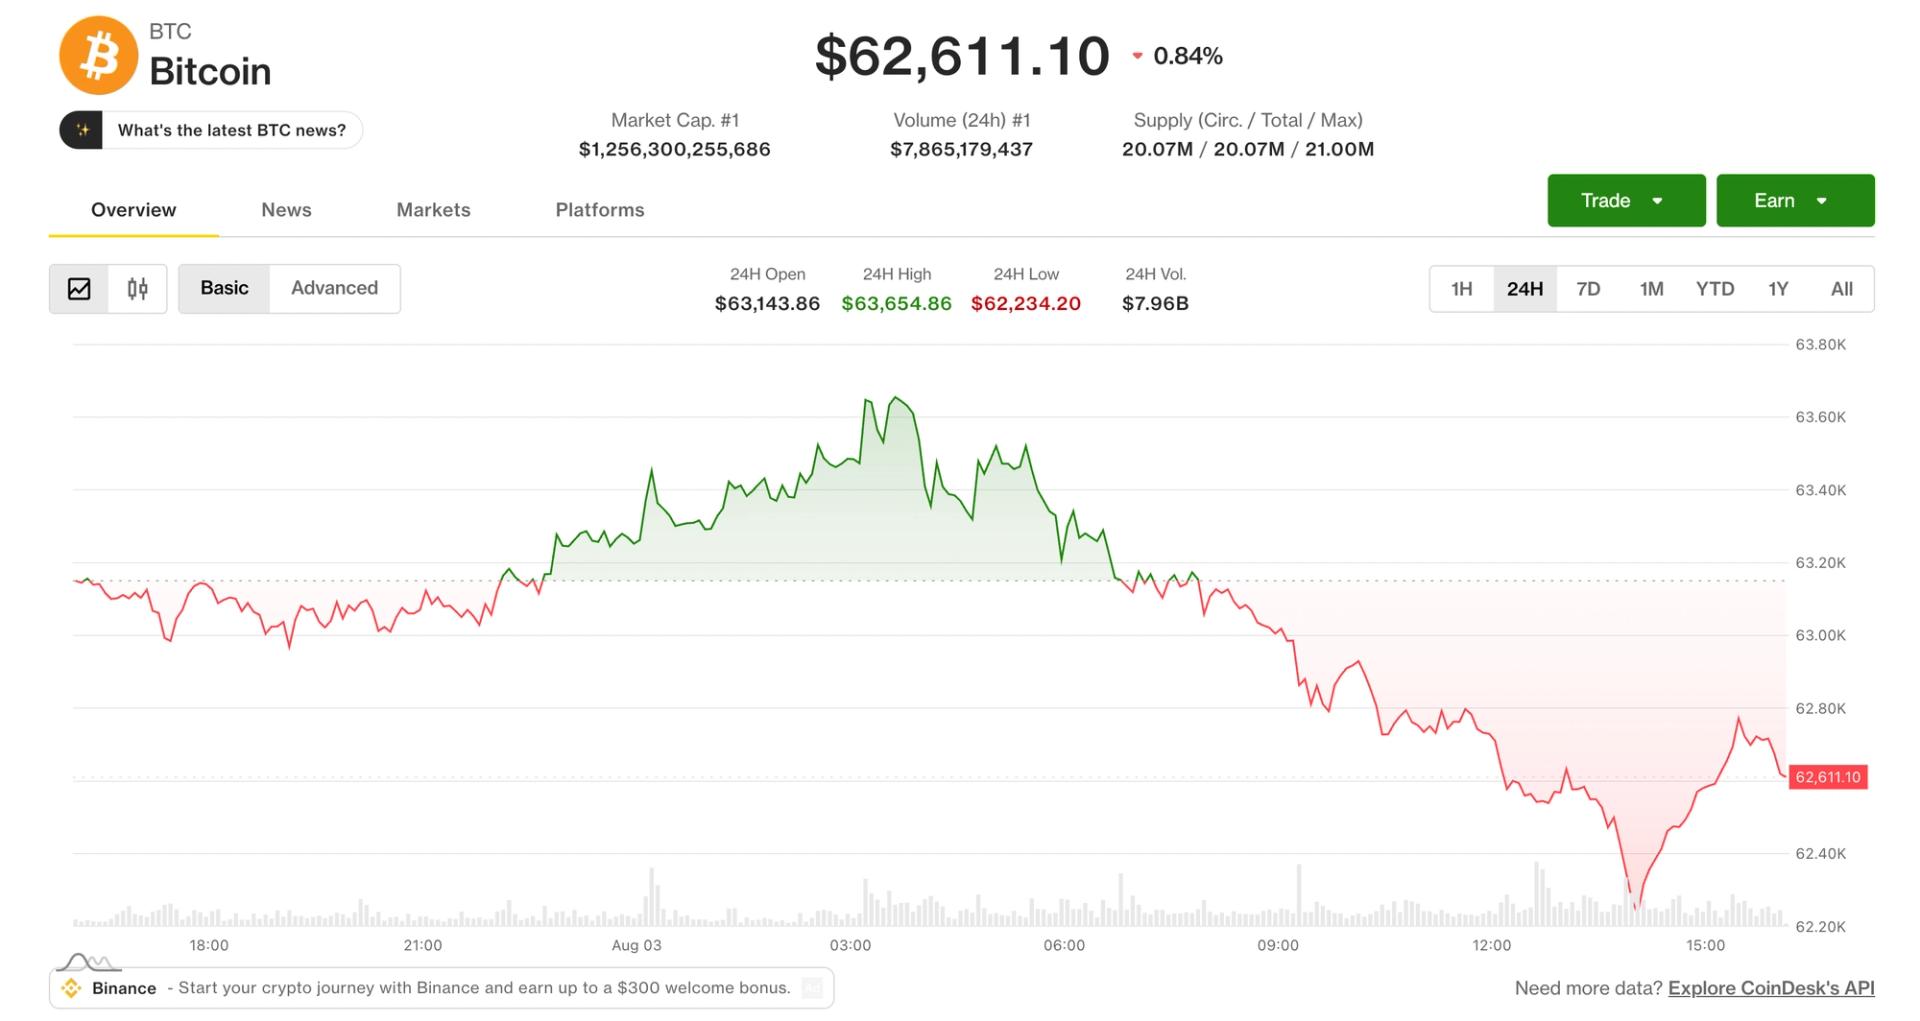
Bitcoin is clinging to a bull market trendline on the 4-hour chart after getting rejected at the 200-period simple moving average — a level that's now acting as resistance. A head and shoulders pattern is still playing out, and its measured move target sits around $60,400. The price action and momentum indicators both suggest the path of least resistance is lower.
The $60,400 Target
The head and shoulders formation has been developing for weeks. With the right shoulder now forming, the pattern's measured move points to roughly $60,400. A small M pattern in the price action and the Stochastic RSI heading down both support a fall from current levels. The $62,250 horizontal level could provide a temporary bounce, but any rally from there might only test the underside of the bull market trendline — confirming it as resistance.
Below the 50-Day SMA
On the daily chart, Bitcoin has already broken down through the bull market trendline and reached horizontal support. The RSI has broken below an ascending wedge, confirming more downside is likely. Price is also breaking down below the 50-day simple moving average. Similar breakdowns during the last two bear flags were followed by major crashes.
Weekly Close Below 200-Week SMA
The weekly chart looks even more precarious. Bitcoin is on the edge of breaking down below the bull market trendline, and last week's close came in just below the 200-week SMA. There's a modicum of support at $60,000, but the price is expected to continue down at least to the bottom of the descending channel, which would take it to $55,000 and below. The weekly Stochastic RSI is showing a much-feared cross-down. If that cross is confirmed after this week, a crash of similar proportions to those from the last two bear flags could result.
For now, all eyes are on the $60,000 level. A break below that opens the door to $55,000 and potentially lower. The weekly close this weekend will be critical for confirming — or invalidating — the bearish setup.