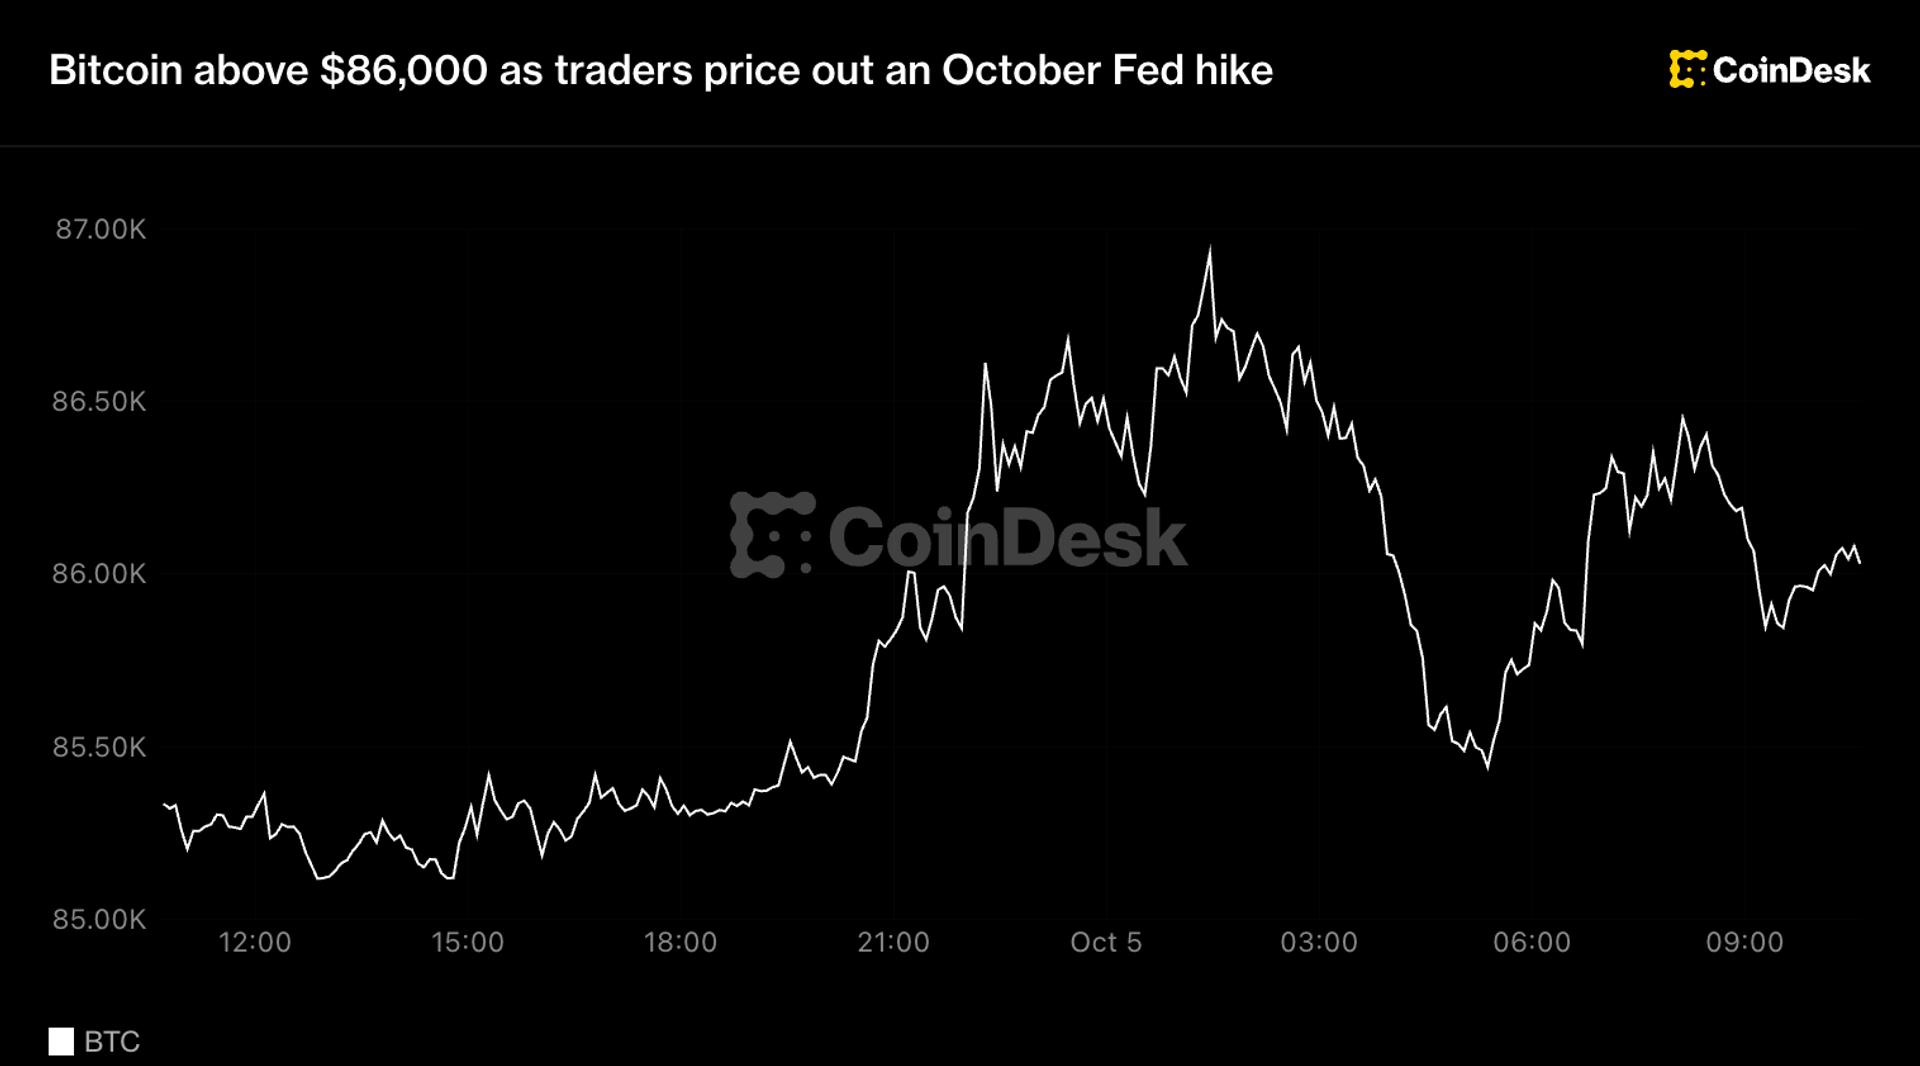
Bitcoin has climbed back to the $87,000 horizontal resistance level but hasn't broken through it yet. On shorter time frames, price is trading inside two bull flag channels, with the upper channel now attempting an upside breakout. The bears aren't out of it either — lower highs have kept stacking up since the first candle wicked out of the channel as it started to form.
Two flags, one missing tilt
The setup is close to textbook, but not quite. Both bull flags lack the classic downward tilt that normally precedes a deeper consolidation. That's a small technical detail with real consequences: without the downward slope, the pattern doesn't carry the same coiled energy that usually fuels a clean breakout.
Momentum indicators are split. The Stochastic RSI has turned down. The RSI, however, still has room to run and hasn't reached overbought territory. On the daily, the broader rally remains intact and the bulls hold the advantage as long as the uptrend stays in place.
$97,880 is the number that ends the bear market
The bear market isn't officially over until the downtrend is definitively broken by a return above $97,880. That hasn't happened. What has happened is the bear market trendline breaking in a forceful manner, which is enough to make a bull market call valid. The two claims aren't contradictory — they just operate on different time frames, and the market is still sorting out which one wins.
Probabilities right now lean toward the rally continuing, with $94,000 sitting as a potential bullish target. That's the near-term upside path if buyers can clear the current resistance zone without giving back the channel structure.
Bond yields and the S&P are part of this trade
Bitcoin won't do this alone. For the rally to keep going, U.S. bond yields need to turn and the U.S. stock market needs to head up toward 8,000 points. That's the macro backdrop the move is leaning on. Crypto can lead for a while, but it rarely sustains a breakout of this size without equities cooperating.
The RSI is also worth watching closely. The indicator line has broken through a huge two-and-a-half-year downtrend. As long as it stays above that line, the overall situation reads bullish. Lose it, and the picture changes quickly.
The correction nobody's priced in yet
A correction will start at some point, and it will probably be deep. The likely form is a much bigger bull flag or a huge falling wedge — similar in shape to the run-up to the top of the last bull market. Before that, there's a real chance of one last rally. That sequence — final push, then deep pullback — is the base case worth planning around, not a tail risk.
For now, the immediate question is whether $87,000 finally gives way or holds as another rejection. A clean break opens the path toward $94,000. A failure here keeps the lower-highs pattern alive and puts the short-term bull flags back under pressure.