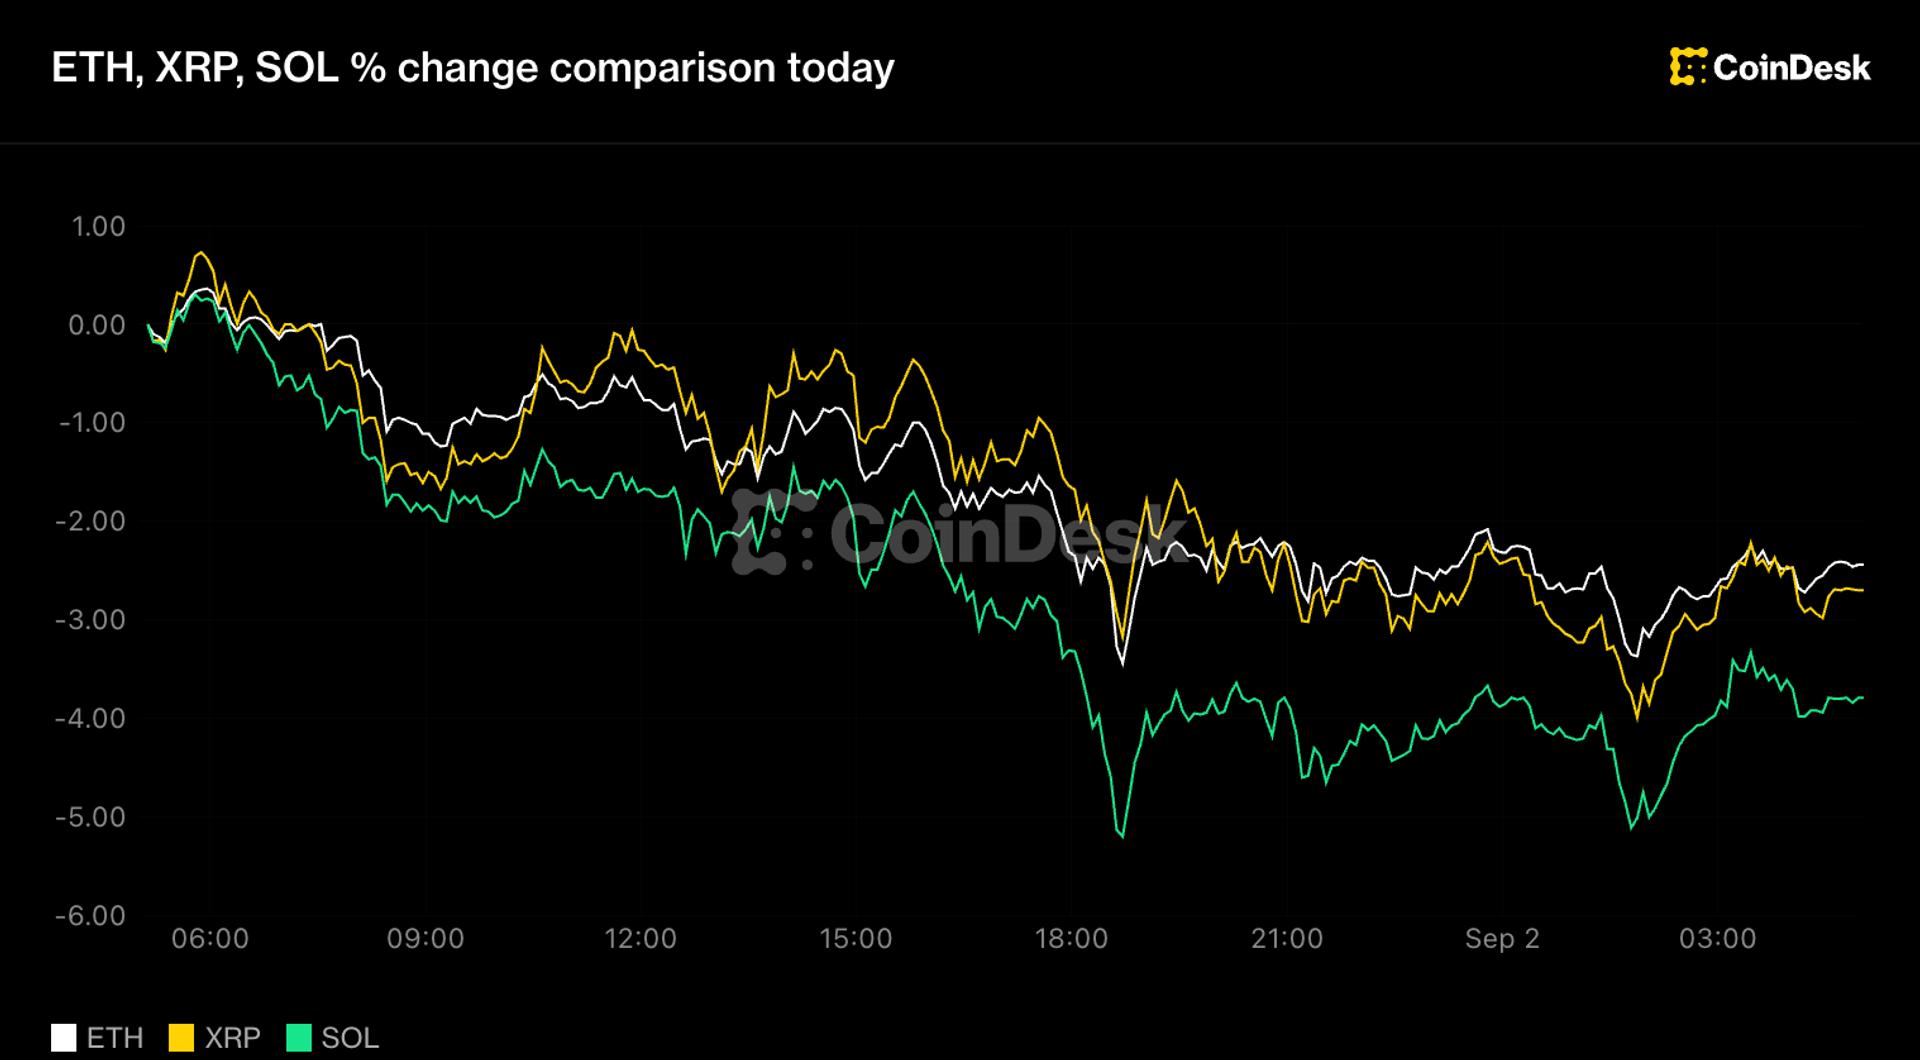
Ethereum is trading at $2,080, caught between a potential bullish reversal pattern on the shorter timeframe and a deteriorating daily structure that could send it toward $1,800. The 100-day moving average at roughly $2,200 is acting as resistance, and the ascending channel floor on the daily chart is flirting with a breakdown. Meanwhile, exchange reserves have crept up from 14.4 million ETH in early May to 14.8 million ETH — still near historic lows, but the modest increase is worth watching.
Price action at a crossroads
The daily chart shows a clear problem: ETH has been grinding lower within an ascending channel, and the floor of that channel is now being tested. If it breaks, the next major demand zone sits around $1,800. The Relative Strength Index has dropped to 35–40, which signals persistent selling pressure without yet hitting oversold territory. That leaves room for more downside before buyers might step in aggressively.
On the 4-hour chart, however, a different pattern is taking shape. An inverse head-and-shoulders formation has been developing, with a neckline at $2,150. If Ethereum can push above that level, the measured move target points to $2,250. That would also mean reclaiming the 100-day moving average, turning resistance into support. The two timeframes are pulling in opposite directions, and which one wins will likely determine the next leg.
Exchange reserves edge up — but still low
Ethereum's exchange reserve sits at 14.8 million ETH, near the lowest levels in recent years. That's generally a bullish signal: less coins on exchanges means less readily available supply to sell. But the trend over the past few weeks is a mild uptick — from 14.4 million in early May to the current 14.8 million. It's not a flood, but it's a change in direction worth monitoring. If reserves continue to rise, it could indicate holders are preparing to sell, adding weight to the bearish case.
What to watch this week
Two levels matter most: $2,150 on the upside and $1,800 on the downside. A daily close above $2,150 would confirm the inverse head-and-shoulders and likely trigger a run toward $2,250. A breakdown of the channel floor, especially on rising volume, opens the door to the $1,800 zone. The RSI hasn't reached oversold yet, so there's no technical signal that a bottom is in. For now, Ethereum is in no man's land — and the next few sessions will decide which way it leans.