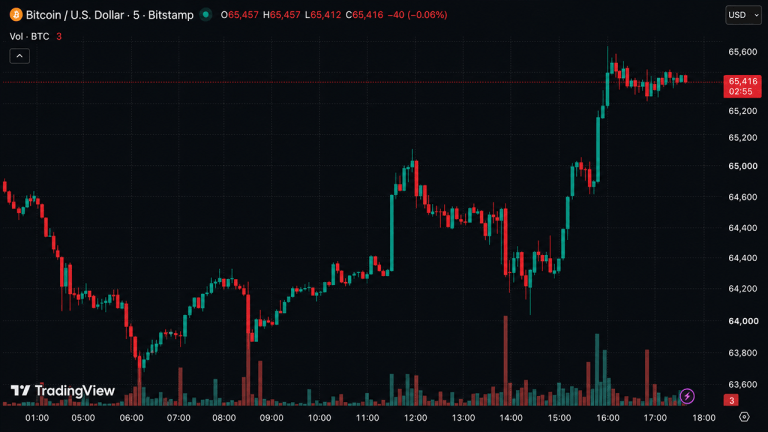
FILE has slipped below its Bollinger lower band, a technical indicator that often signals an asset is oversold — but in this case, the selling pressure hasn't let up. The token is now pressing against immediate support at $0.69, and traders are watching closely for a potential flush to $0.68.
Bollinger Band Break Signals Weakness
The Bollinger lower band is a volatility-based support level. When price breaks below it, it typically suggests that selling momentum is strong enough to push beyond normal trading ranges. FILE's move below that band is the latest sign of bearish dominance in the market. The band itself is now sloping downward, indicating that volatility is expanding to the downside.
Aggressive Taker Selling Dominates Flow
Order book data shows aggressive taker selling has been the main driver of the recent decline. Market makers and passive bidders have been repeatedly hit by sell orders that eat through the bid stack. This type of flow often precedes a quick drop to the next major support level, as buyers are reluctant to step in until prices reach a more attractive entry point.
Next Support Level at $0.68
If $0.69 fails to hold, the next logical support is $0.68. That level has acted as a floor in previous trading sessions and could attract buyers looking for a bounce. However, with selling pressure still dominating, a flush to $0.68 looks probable before any meaningful recovery can take hold. Traders are now watching whether volume picks up at that level or if the sell-off accelerates further.