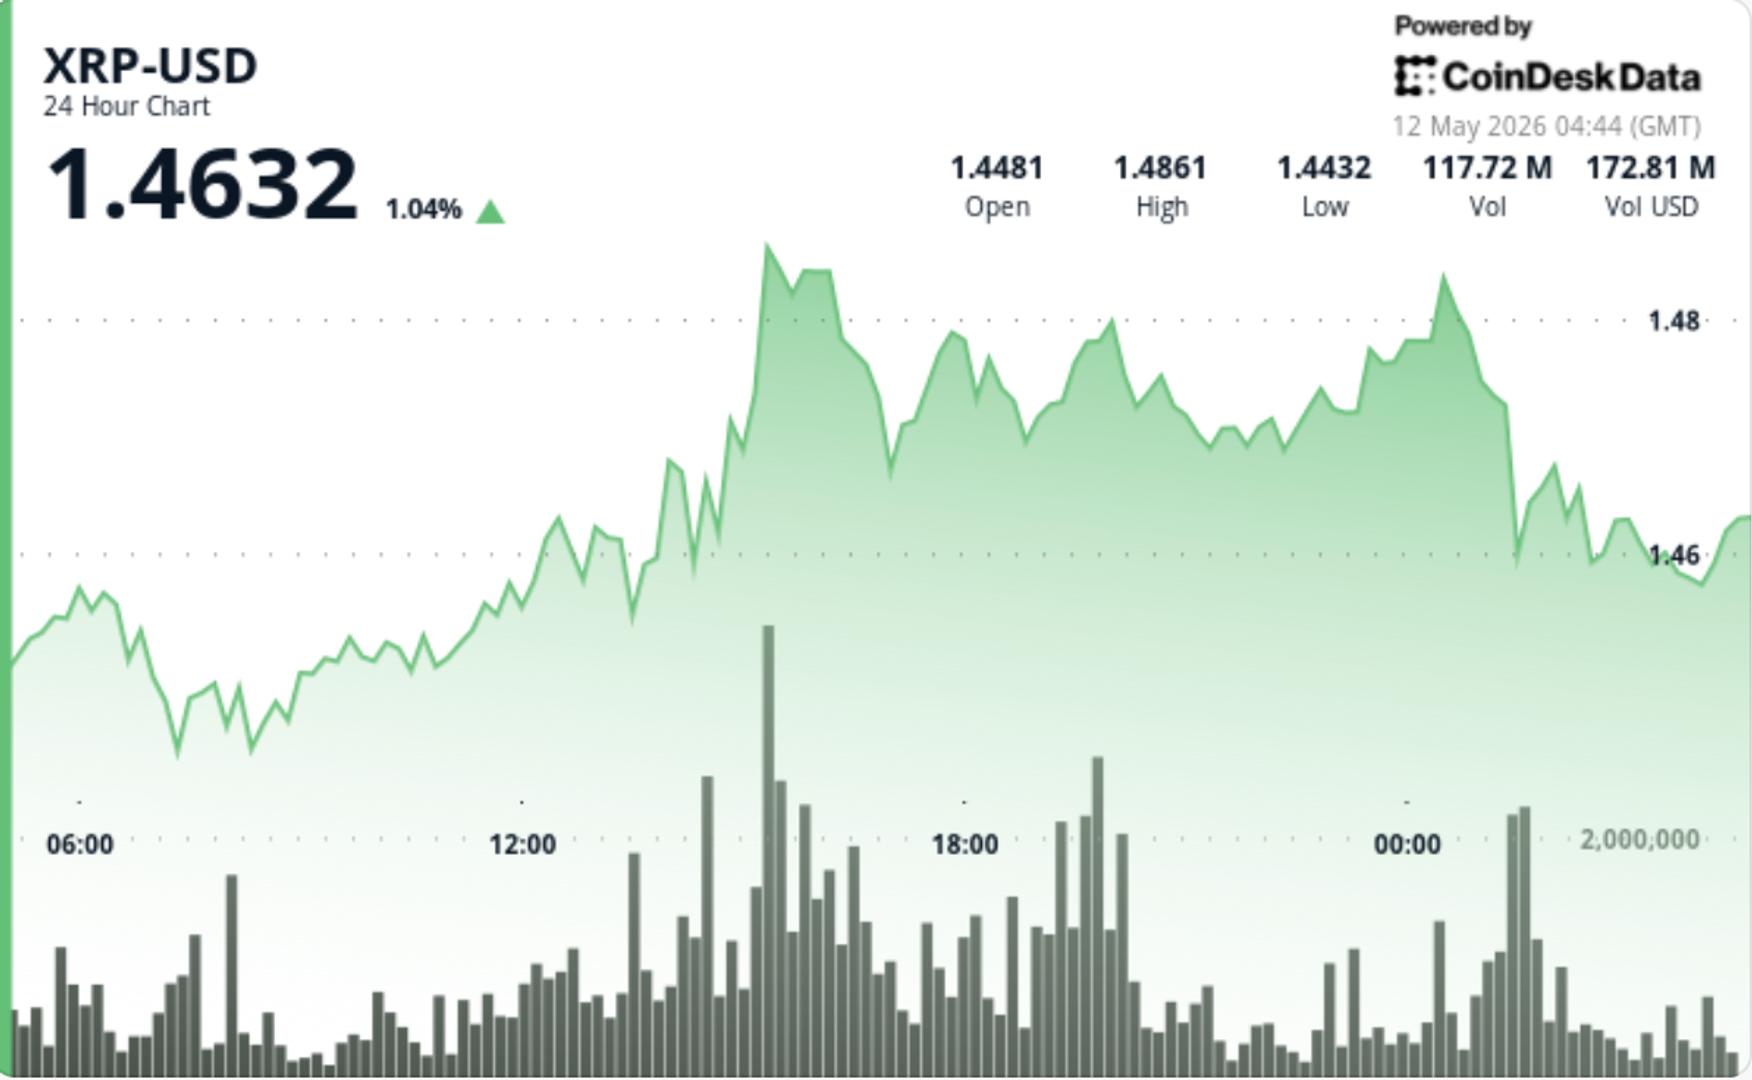
XRP's price has been grinding higher since breaking above $1.3880 and $1.4050, and it's now trading above both the $1.4050 mark and the 100-hourly simple moving average. A bullish trend line forming with support at $1.3910 on the hourly chart of the XRP/USD pair (data from Kraken) is keeping the rally intact, and traders are eyeing a move above $1.420 for the next leg up. The cryptocurrency hit a high of $1.4199 before entering a consolidation phase, leaving the market waiting for a decisive breakout.
Key Resistance Levels to Watch
The first major hurdle sits at $1.420. If XRP can settle above that level, the next targets are $1.4320 and then $1.450. A stronger push could send the price toward $1.4740 and eventually the psychological $1.50 mark. The hourly MACD is gaining pace in the bullish zone, and the RSI is above 50 — both signals that buyers remain in control for now.
What Happens If XRP Fails to Clear $1.420
If the rally stalls, initial downside support is near $1.3910 and the trend line. The next major support is at $1.3830, which corresponds to the 50% Fibonacci retracement level of the move from $1.3460 to $1.4199. A break below that could accelerate losses toward $1.3550, then $1.3320, $1.320, and finally the main support at $1.3120.
Technical Indicators Signal Bullish Momentum
The hourly MACD is gaining pace in the bullish zone, confirming upward momentum. The RSI is above 50, indicating buying pressure is still present. These metrics suggest that the current consolidation phase could resolve to the upside if XRP can punch through $1.420.
The pair could continue to move up if it settles above $1.420. A clear break above that level would open the door to $1.4320, $1.450, and beyond. On the flip side, a slip below the trend line at $1.3910 might trigger a deeper pullback toward the 50% Fib retracement at $1.3830. Traders will watch for a decisive move in the next few sessions.