Executive Summary
Bitcoin's Relative Strength Index (RSI) has reached deeply oversold levels, prompting fears of potential market consolidation and further price corrections.
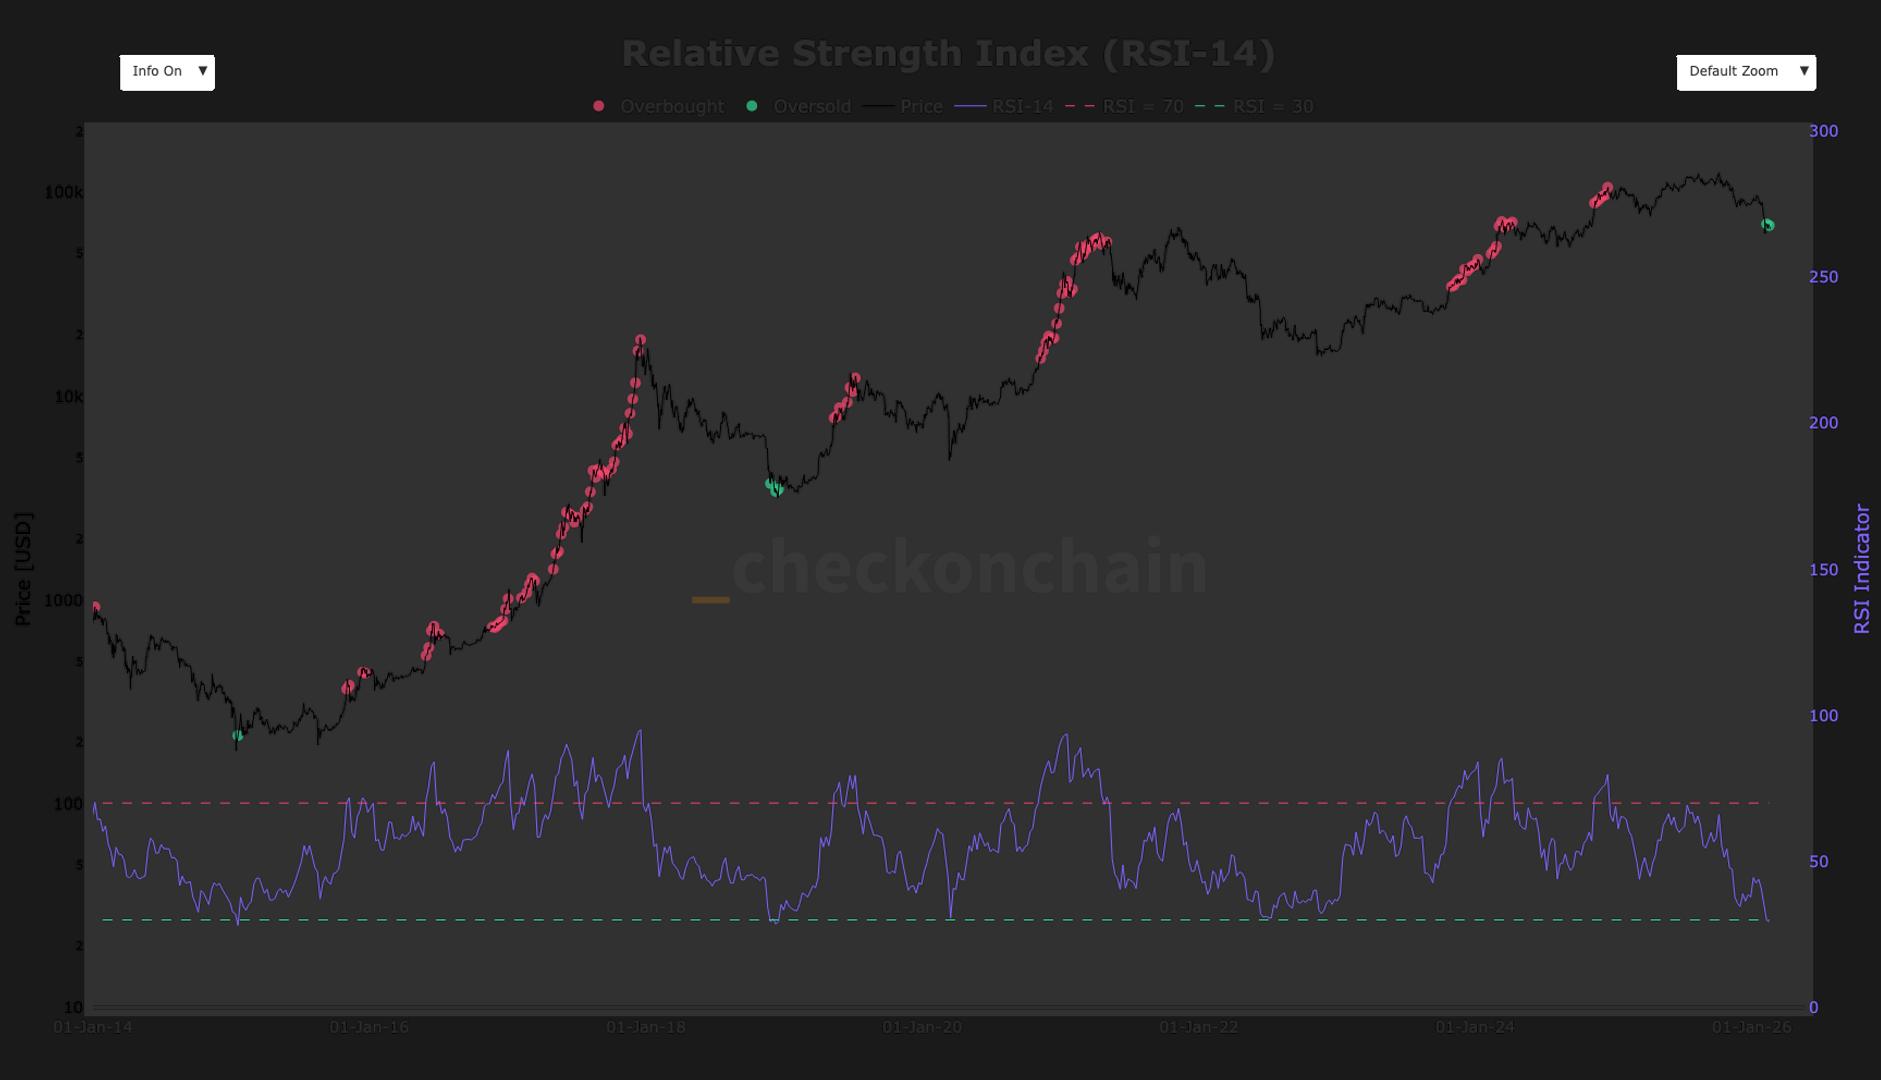
What Happened
Bitcoin’s RSI, an indicator of market momentum, has fallen to around 27, marking one of its lowest points in history. This indicator's low level suggests extreme oversold conditions, which previously have led to extended consolidation periods.
Key Details
Bitcoin has experienced a significant decline, dropping approximately 52% from its late‑2025 peak of nearly $126,000. It is now approaching critical psychological and technical support near $60,000. Analysts have pinpointed this level as a crucial battleground; failure to hold could see further declines to between $37,000 and $40,000.
Market Context
The cryptocurrency has been trading in a confined range between $60,000 and $70,000 after a sharp decline from about $90,000. Market sentiment reflects extreme fear, suggesting capitulation might bolster a consolidation zone between $60,000 and $75,000.
Market Data Snapshot
Primary Asset: Bitcoin (BTC)
- Current Price: $58,000
- 24h Price Change: -2.35%
- 7d Price Change: -7.81%
- Market Cap: $1.09 Trillion
- Volume Signal: High
- Market Sentiment: Bearish
- Fear & Greed Index: 15 (Extreme Fear)
- On-Chain Signal: Bearish
- Macro Signal: Bearish
Bitcoin dominance remains strong, highlighting its potential as a market mover.
Market Health Indicators
Technical Signals
- Support Level: $60,000 - Tested
- Resistance Level: $70,000 - Strong
- RSI (14d): 27 - Oversold
- Moving Average: Below key MA levels
On-Chain Health
- Network Activity: High
- Whale Activity: Distributing
- Exchange Flows: Inflow
- HODLer Behavior: Weak Hands
Macro Environment
- DXY Impact: Negative
- Bond Yields: Headwind
- Risk Appetite: Risk-Off
- Institutional Flow: Selling
Why This Matters
For Traders
The current market conditions suggest traders need to watch the $60,000 support level closely to strategize short-term moves.
For Investors
Long-term investors may need to assess potential opportunities at lower support levels given the volatility.
What Most Media Missed
The extreme sentiment and technical indicators suggest a possible market bottom, offering insights for long-term positioning.
What Happens Next
Short-Term Outlook
Monitoring how Bitcoin reacts around the $60,000 mark will be crucial over the next few days.
Long-Term Scenarios
Bitcoin could either find a strong foothold or prepare for deeper corrections if support levels break.
Historical Parallel
Prior instances of RSI reaching similar lows have heralded consolidation phases and potential market rebounds.