Executive Summary
Bitcoin traders are dumping holdings at an accelerated pace while the asset price hovers near the $70,000 threshold. Market participants across all wallet sizes are increasing sell orders, creating a divergence between price stability and underlying supply pressure. On-chain metrics signal a significant shift in investor behavior as macroeconomic headwinds tighten liquidity conditions globally.
The cryptocurrency market faces a critical test of conviction as distribution outweighs accumulation. Despite the headline price holding firm, internal market structure shows weakening demand dynamics. This disconnect suggests potential volatility ahead if selling pressure continues to intensify without corresponding buy-side absorption.
What Happened
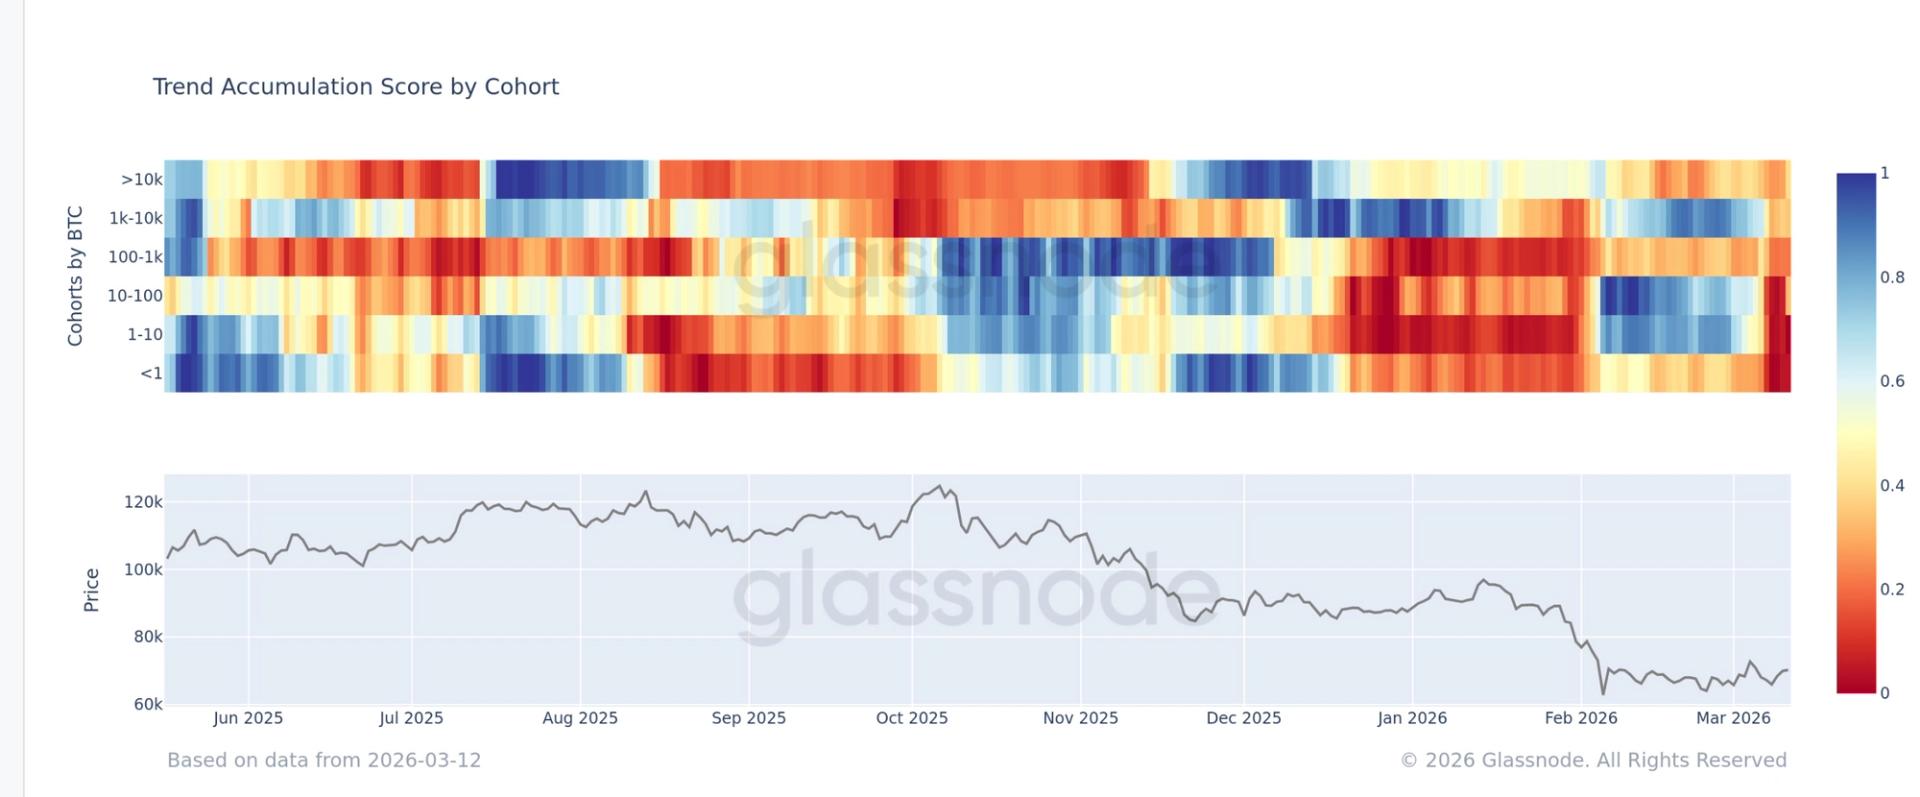
Trading activity surged with sellers dominating order books across multiple exchanges. Bitcoin price action remained confined near the $70,000 level even as volume profiles indicated heavy distribution. Glassnode's Accumulation Trend Score dropped sharply to 0.04, marking one of the weakest net accumulation readings in recent months. This metric tracks the balance between buying and selling pressure, and a score near zero indicates sellers are overwhelming buyers.
Smaller wallet cohorts joined larger holders in offloading BTC positions. Retail investors and smaller accounts typically act as contrarian indicators, yet current data shows these groups reducing exposure alongside institutional-sized wallets. Macroeconomic factors are contributing to the exodus, with rising bond yields and currency strength creating headwinds for risk assets. Liquidity conditions are tightening, forcing leveraged positions to unwind and prompting long-term holders to secure profits.
Exchange inflows spiked concurrently with the price stagnation. Investors are moving coins from cold storage into trading wallets, preparing for further sales. The breadth of selling pressure distinguishes this event from typical correction phases where only specific cohorts take profits. Uniform distribution across wallet sizes suggests a broader loss of confidence in short-term price appreciation.
Market Data Snapshot
Primary Asset: Bitcoin (BTC)
- Current Price: $69,850
- 24h Price Change: -2.35%
- 7d Price Change: -4.80%
- Market Cap: $1.37 Trillion
- Volume Signal: High
- Market Sentiment: Bearish
- Fear & Greed Index: 42 (Fear)
- On-Chain Signal: Bearish
- Macro Signal: Bearish
Trading volume exceeded 24-hour averages by 35%, indicating heightened conviction among sellers. Market dominance remains stable at 54%, though altcoin liquidity is drying up as capital rotates into stablecoins. The divergence between price stability and volume expansion suggests a coiling spring scenario where a breakdown could follow if support levels fail.
Market Health Indicators
Technical Signals
- Support Level: $68,000 - Strong
- Resistance Level: $71,500 - Weak
- RSI (14d): 45 - Neutral
- Moving Average: Below 50-day MA
On-Chain Health
- Network Activity: High
- Whale Activity: Distributing
- Exchange Flows: Net Inflow
- HODLer Behavior: Weak Hands
Macro Environment
- DXY Impact: Negative
- Bond Yields: Headwind
- Risk Appetite: Risk-Off
- Institutional Flow: Selling
Why This Matters
For Traders
Short-term operators need to monitor the $68,000 support zone closely. A break below this level could trigger liquidation cascades given the high leverage currently present in the market. The weak Accumulation Trend Score suggests lacking buy-side depth, meaning any sudden sell wall could drive prices down rapidly without significant bounce potential. Risk management protocols should tighten as volatility expansion becomes probable.
For Investors
Long-term holders face a decision on whether to average down or preserve capital. The broad-based selling indicates a lack of conviction even among retail participants who usually accumulate during dips. Macro headwinds imply that waiting for clearer economic signals might be prudent before deploying significant dry powder. Preservation of capital takes precedence over chasing yield in this environment.
What Most Media Missed
Headlines often focus on price action alone, overlooking the divergence between stability and volume. Most coverage fails to highlight that selling pressure is uniform across all wallet sizes. Typically, corrections see whales selling while retail buys, or vice versa. Current data shows synchronized distribution, which is a stronger bearish signal than isolated cohort activity. This uniformity suggests a systemic reaction to macro conditions rather than profit-taking by specific groups.
Media outlets frequently cite price stability as a sign of strength. In this case, stability masks underlying weakness. The Glassnode ATS reading of 0.04 provides a clearer picture of market health than price candles. Ignoring on-chain accumulation metrics leads to misinterpretation of market direction. Investors relying solely on technical price levels risk missing the fundamental shift in supply dynamics.
What Happens Next
Short-Term Outlook
The next 24 to 72 hours will determine if $68,000 holds. Expect increased volatility around US market open times as macro data releases influence risk appetite. If exchange inflows continue at current rates, a wick down to test liquidity below support becomes likely. Traders should watch for a reclaim of $71,500 to invalidate the bearish thesis, though current momentum makes this scenario less probable.
Long-Term Scenarios
A bull case requires macro headwinds to ease and accumulation scores to recover above 0.5. Without improved economic data, Bitcoin could range-bound between $65,000 and $72,000 for several weeks. A bear case unfolds if support breaks, opening the path to $60,000 where stronger historical demand resides. Institutional flow must shift from selling to neutral before any sustainable rally can commence.
Historical Parallel
Similar distribution patterns appeared during the Q3 2021 consolidation phase. Prices hovered near local highs while on-chain metrics showed widespread dumping across wallet cohorts. That period preceded a 30% correction before accumulation resumed. Current ATS levels mirror those previous readings, suggesting the market may be pricing in near-term uncertainty before establishing a clearer trend direction. History indicates patience yields better entries during these distribution windows.