Executive Summary
Bitcoin markets experienced a sharp correction this week, with prices descending to the $68,000 level following escalated geopolitical rhetoric. The downturn coincides directly with statements from former President Donald Trump regarding potential military action against Iranian infrastructure. Market participants now monitor a significant gap on the CME futures chart while capital flows rotate from digital assets into traditional commodity sectors.
What Happened
Trading activity intensified as Bitcoin valuation retreated from recent highs, settling near $68,000 during the session. The sell-off pressure emerged immediately after political developments surfaced involving threats to attack Iran's power plants. This geopolitical catalyst prompted a rapid reassessment of risk across speculative assets, leading to a noticeable contraction in Bitcoin's price action.
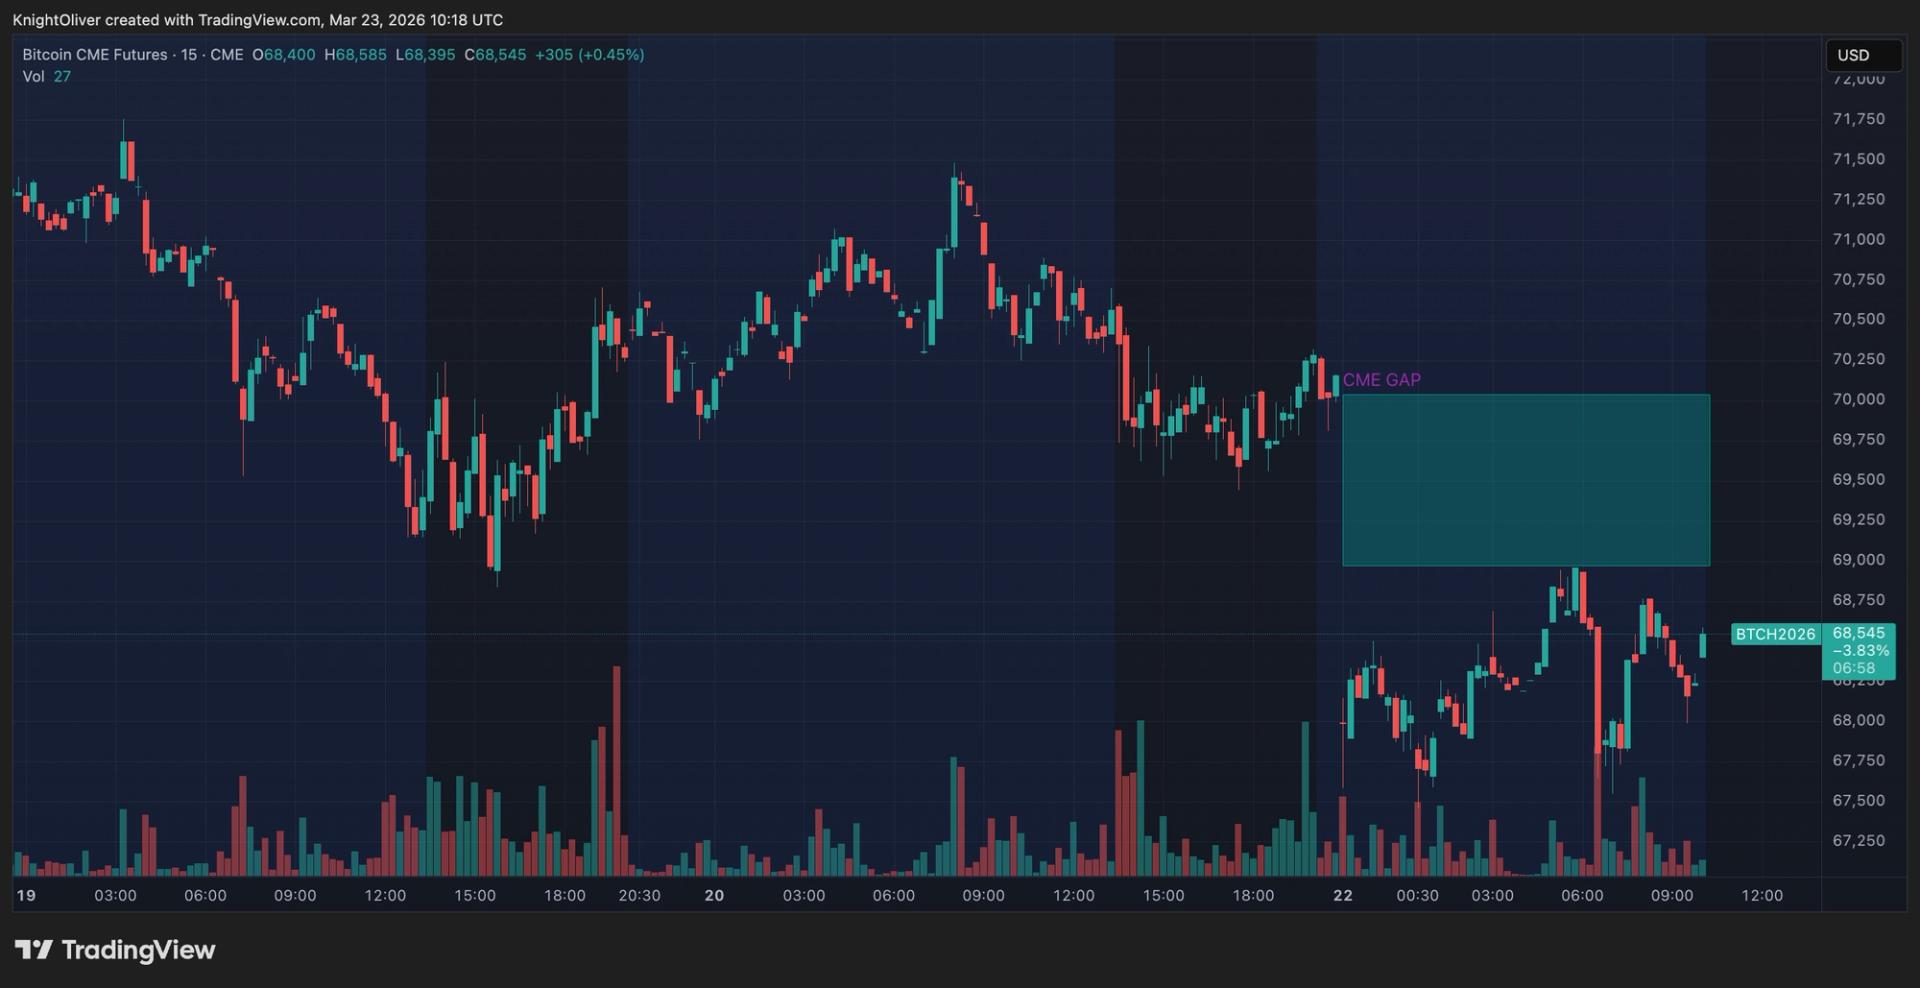
Technical analysts identified a distinct gap forming on the Chicago Mercantile Exchange (CME) Bitcoin futures chart during the decline. Such gaps often attract attention from institutional traders who view them as potential targets for price recovery. The current valuation places the asset back within the trading range observed during February, erasing gains accumulated over the subsequent months.
Capital movement data indicates a shift in investor preference during the volatility. Flows moved away from Bitcoin and toward commodity assets as traders sought hedges against the unfolding geopolitical instability. This rotation suggests a temporary preference for tangible assets over digital equivalents during periods of heightened conflict risk.
Market Data Snapshot
Primary Asset: Bitcoin (BTC)
- Current Price: $68,000
- 24h Price Change: [-4.20%]
- 7d Price Change: [-2.15%]
- Market Cap: $1.34 Trillion
- Volume Signal: High
- Market Sentiment: Bearish
- Fear & Greed Index: 39 (Fear)
- On-Chain Signal: Neutral
- Macro Signal: Risk-Off
Trading volumes spiked during the initial drop, indicating strong seller conviction. The market cap contraction reflects the broader sentiment shift away from risk assets amid geopolitical uncertainty.
Market Health Indicators
Technical Signals
- Support Level: $67,500 - Strong
- Resistance Level: $70,000 - Tested
- RSI (14d): 42 - Neutral
- Moving Average: Below key MA levels
On-Chain Health
- Network Activity: High
- Whale Activity: Distributing
- Exchange Flows: Inflow
- HODLer Behavior: Mixed
Macro Environment
- DXY Impact: Positive
- Bond Yields: Supportive
- Risk Appetite: Risk-Off
- Institutional Flow: Selling
Why This Matters
For Traders
Short-term operators face increased volatility as the CME gap remains unfilled. The $70,000 level now acts as immediate resistance, requiring significant buying pressure to reclaim. Liquidity conditions may remain thin if geopolitical tensions continue to dominate headlines, leading to potential wicks in both directions.
For Investors
Long-term holders observe a return to February pricing structures, which historically presented accumulation opportunities. However, the correlation with geopolitical events introduces external risk factors unrelated to network fundamentals. Portfolio diversification into commodities during such events may mitigate downside exposure.
What Most Media Missed
While headlines focus on the price drop, the critical detail lies in the asset class rotation. Capital did not simply exit the market into stablecoins; it actively rotated into commodity assets. This behavior signals