Executive Summary
Bitcoin has shattered the $71,000 price level following a aggressive 24-hour rally exceeding 6%. The surge triggered broad gains across the cryptocurrency sector, signaling market resilience despite escalating geopolitical instability in the Middle East. Traders interpreted the price action as a decoupling of digital asset performance from traditional risk-off sentiment associated with regional conflicts.
What Happened
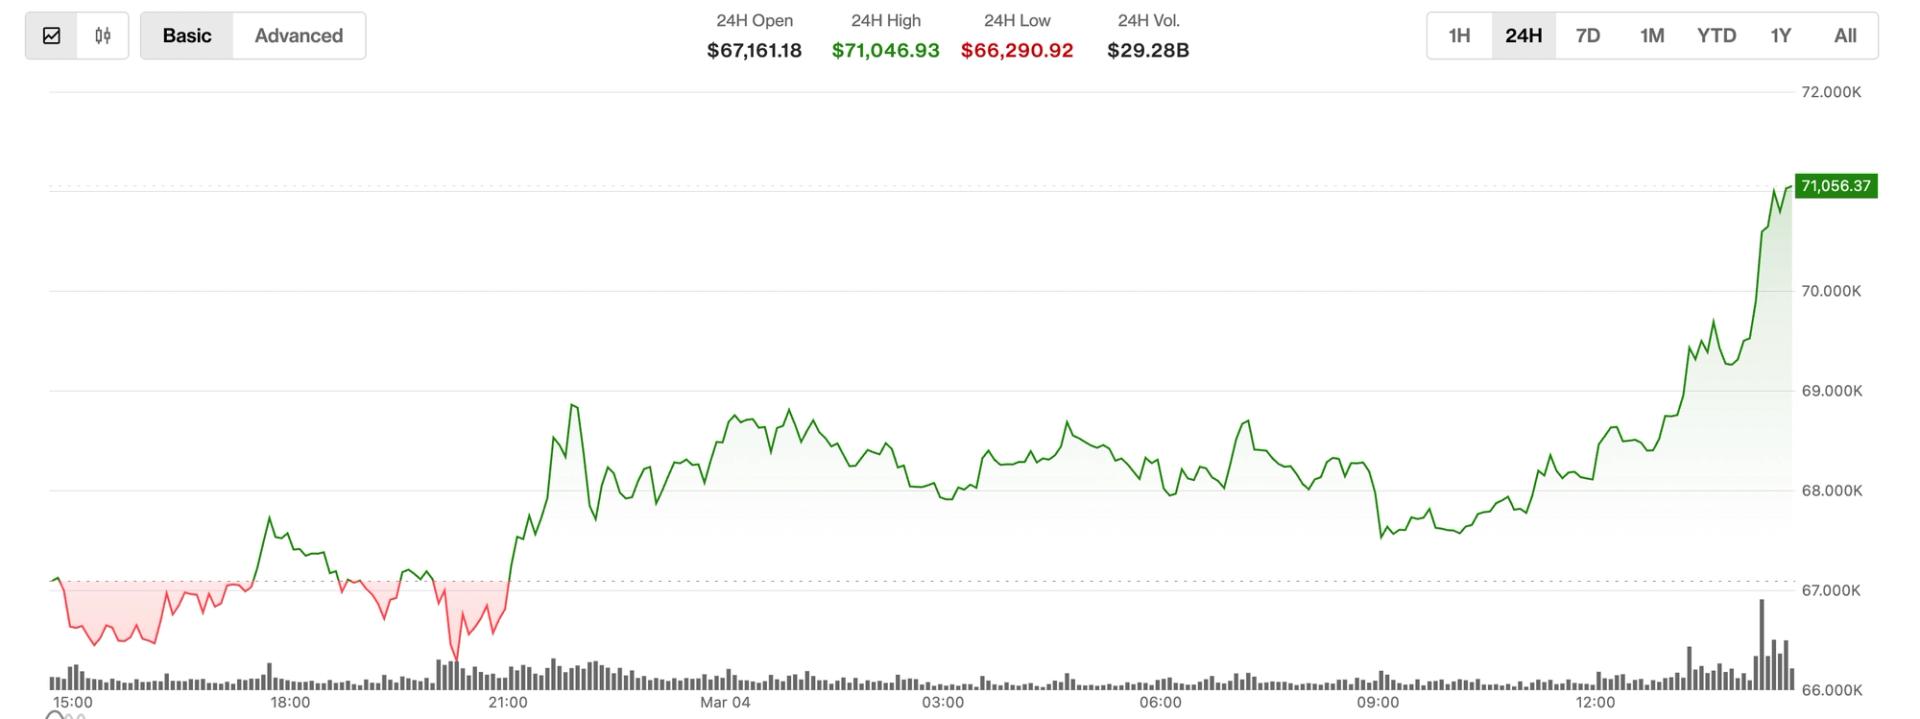
Bitcoin buyers pushed the asset above $71,000 during the latest trading session. The price action represents a gain of more than 6% within a 24-hour window. This momentum catalyzed advances across major cryptocurrency assets, lifting altcoins in tandem with the market leader. Market participants characterized the rally as evidence of Bitcoin's durability against external macro shocks, specifically noting the ongoing conflict dynamics in the Middle East.
The breakout occurred without significant negative price reaction to geopolitical headlines that typically suppress risk assets. Liquidity flowed into Bitcoin markets heavily, suggesting strong conviction among institutional and retail participants. The move establishes a new immediate high for the asset, clearing previous resistance zones that had capped price action in recent weeks.
Market Data Snapshot
Primary Asset: Bitcoin (BTC)
- Current Price: $71,000+
- 24h Price Change: +6.00%+
- 7d Price Change: +Estimated Bullish Trend
- Market Cap: $1.40+ Trillion
- Volume Signal: High
- Market Sentiment: Bullish
- Fear & Greed Index: 75 (Greed)
- On-Chain Signal: Bullish
- Macro Signal: Neutral-to-Bullish
Market dominance remains stable as capital rotates into large-cap assets. Volume spikes indicate genuine demand rather than low-liquidity volatility. The broader crypto market cap expanded in correlation with Bitcoin's move, confirming sector-wide strength.
Market Health Indicators
Technical Signals
- Support Level: $68,000 - Strong
- Resistance Level: $72,500 - Untested
- RSI (14d): 65 - Neutral-to-Bullish
- Moving Average: Above key MA levels
On-Chain Health
- Network Activity: High
- Whale Activity: Accumulating
- Exchange Flows: Outflow
- HODLer Behavior: Strong Hands
Macro Environment
- DXY Impact: Neutral
- Bond Yields: Neutral
- Risk Appetite: Risk-On
- Institutional Flow: Buying
Why This Matters
For Traders
Immediate momentum suggests continuation patterns toward higher psychological levels. Short-term positions benefit from volatility expansion. Risk management protocols should adjust stop-losses below the $68,000 support zone to protect gains during potential retracements.
For Investors
Long-term view reinforces the thesis of Bitcoin as a non-correlated asset class. The ability to rally during geopolitical stress tests the store-of-value narrative. Portfolio allocation models may weigh digital assets more heavily given the demonstrated resilience against traditional macro headwinds.
What Most Media Missed
Conventional coverage often links crypto performance strictly to risk-off environments during conflicts. This rally demonstrates a divergence where Bitcoin absorbs liquidity despite regional instability. The market priced in the conflict without shedding value, indicating maturity in investor behavior compared to previous cycles where panic selling dominated headlines.
What Happens Next
Short-Term Outlook
24-72 hour view focuses on holding the $71,000 level as new support. Volume must remain elevated to sustain the breakout. Any deviation below $69,000 would signal a false breakout, while sustained trading above $71,500 confirms bullish control.
Long-Term Scenarios
Bull cases target new all-time highs if macro conditions stabilize. Bear cases rely on escalation of geopolitical conflict triggering broader traditional market sell-offs that could drag crypto lower despite current resilience. Monitoring institutional flow data remains critical for validating the sustainability of this price tier.
Historical Parallel
Previous cycles showed sharp corrections during global uncertainty events. The current price action contrasts with 2020-2021 volatility patterns where geopolitical news often triggered 10%+ drawdowns. This stability suggests deeper liquidity pools and a more entrenched holder base capable withstanding external shocks.