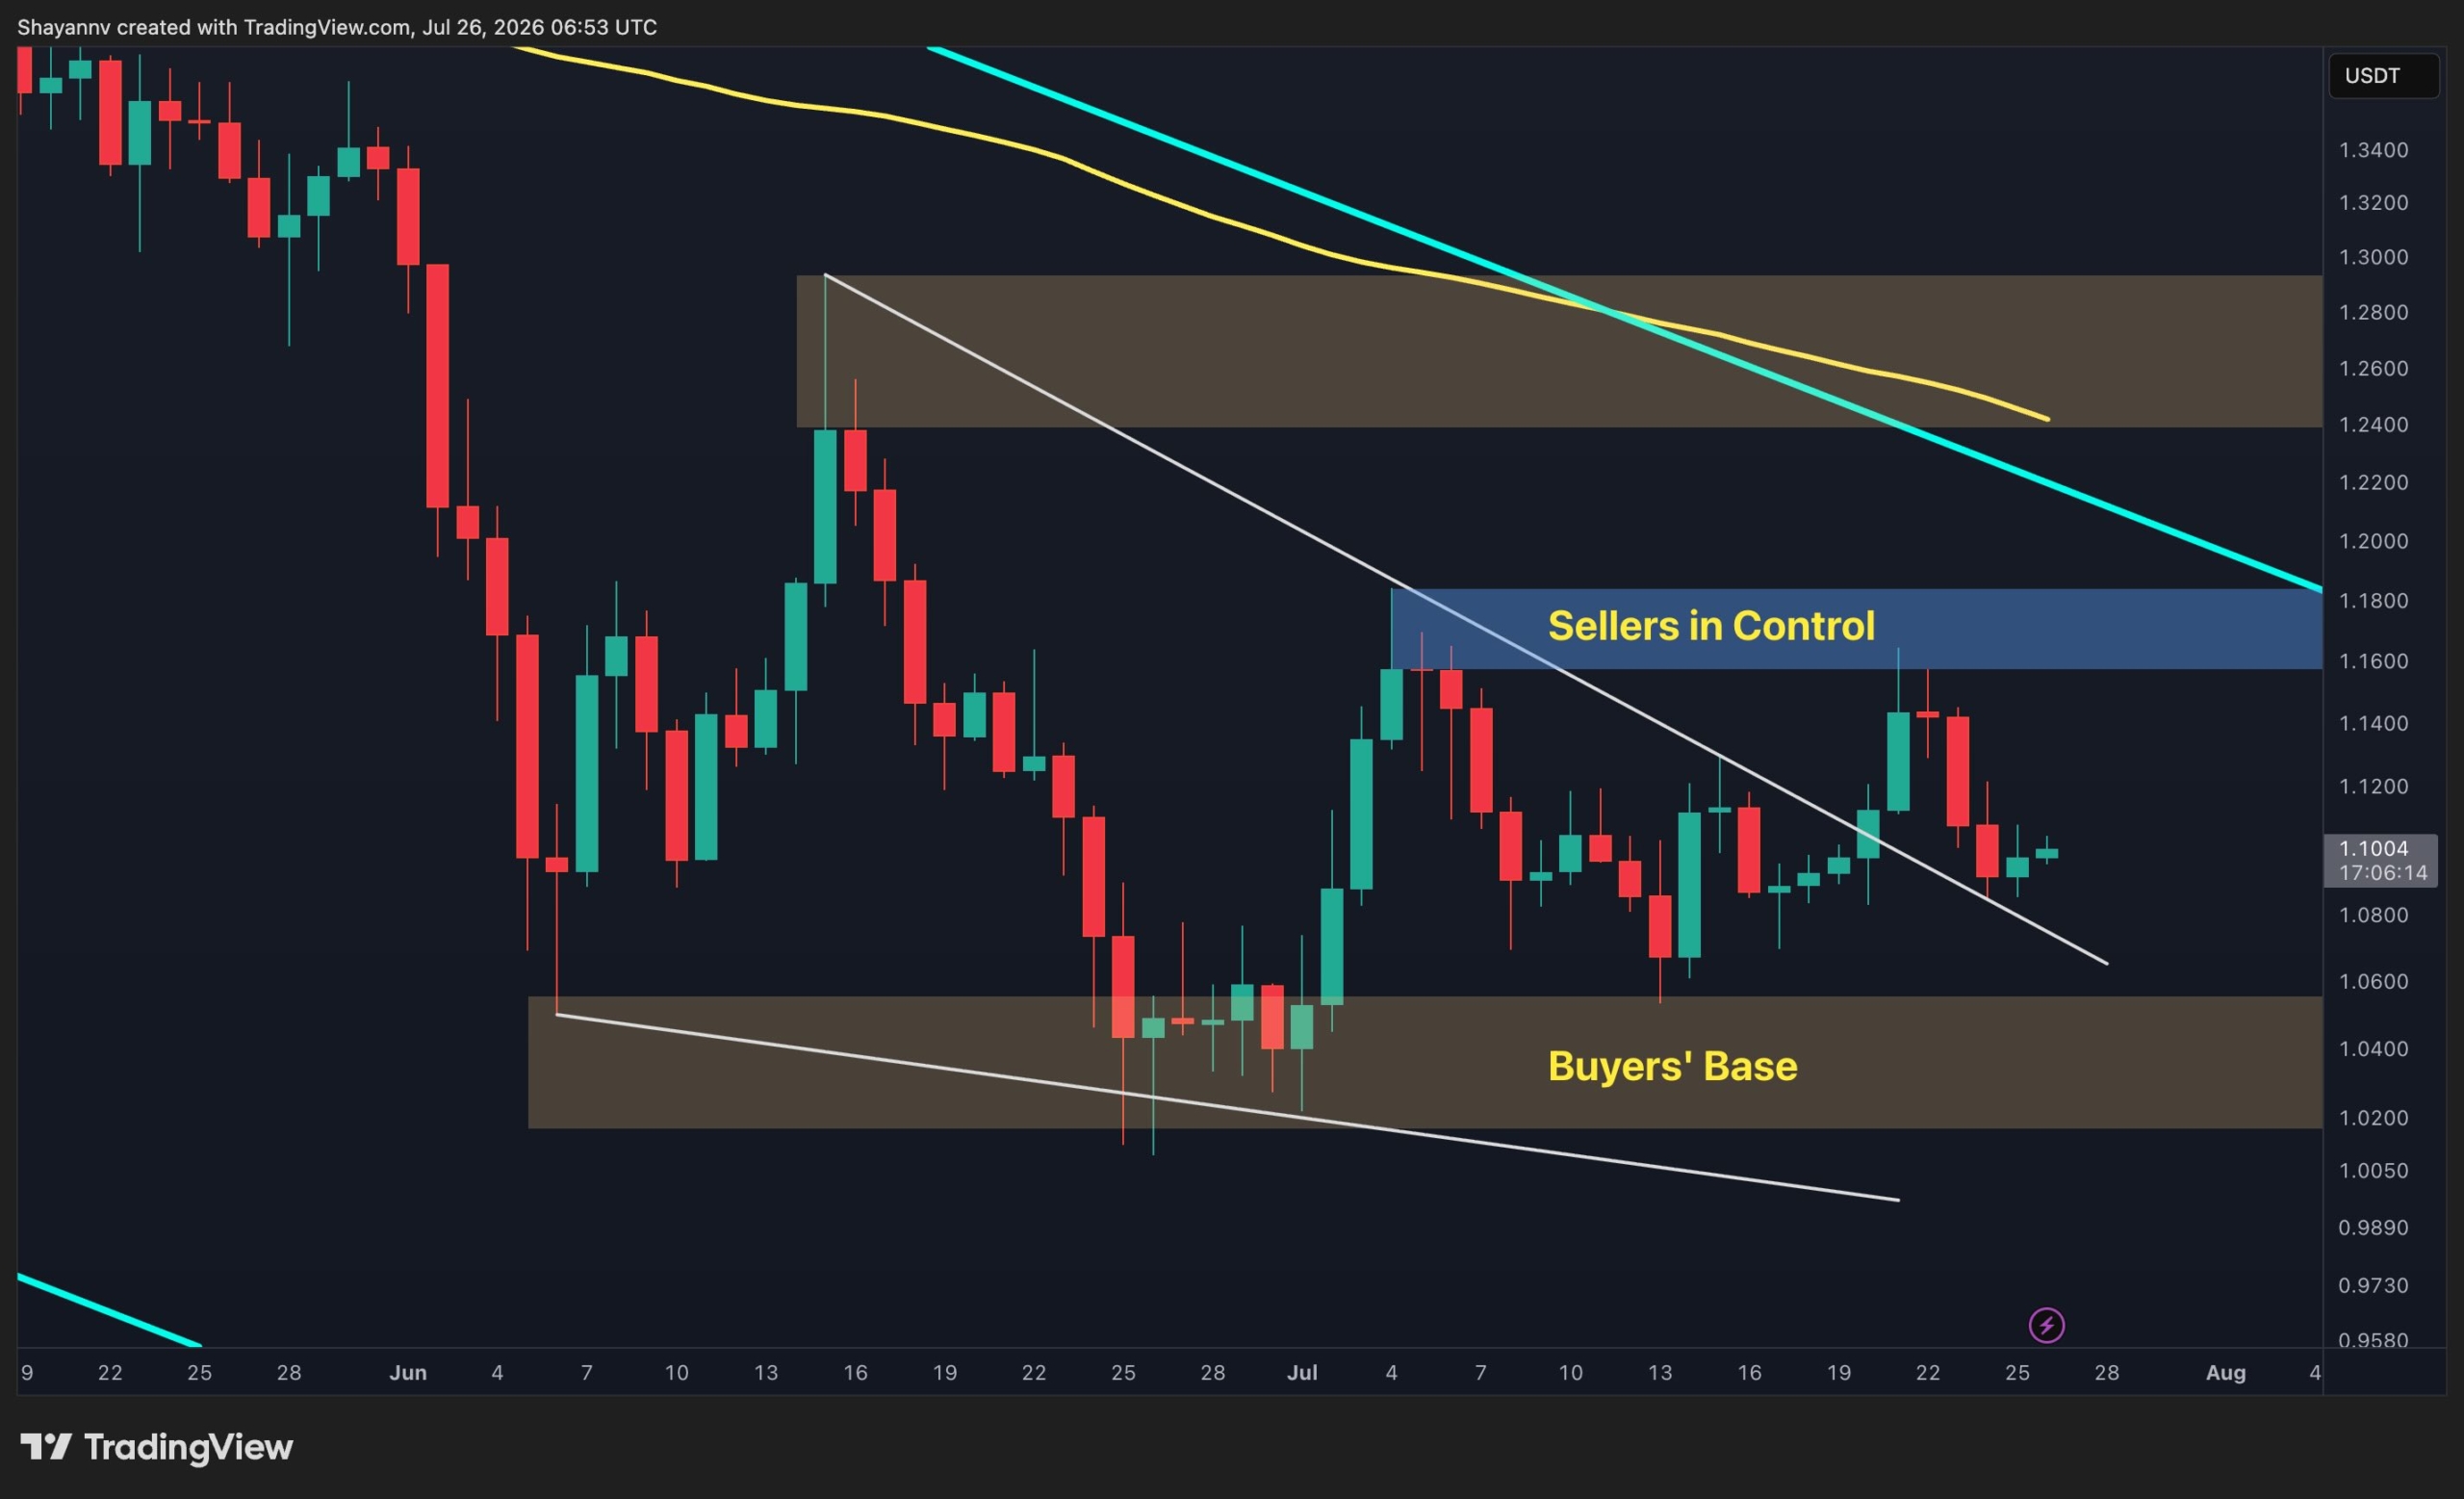
Ethereum is testing a critical resistance zone this week after a strong rebound from its local bottom. The second-largest cryptocurrency by market cap is holding above a previously broken descending trendline, suggesting improved medium-term structure, but it's now bumping into a supply area between $1.88K and $1.91K. A declining 100-day moving average near $1.95K adds another layer of overhead pressure.
Support and resistance levels
The market has established higher highs and higher lows while consolidating above the $1.76K to $1.82K support region. That zone is the immediate floor — as long as price stays above it, buyers keep the short-term advantage. If that support gives way, the next stop would be around $1.55K to $1.64K, a move that would weaken the bullish structure significantly. On the upside, the broader long-term supply zone sits between roughly $2K and $2.15K, but ETH first needs to clear the $1.88K-$1.91K hurdle and the 100-day moving average.
Short-term trend showing cracks
On the 4-hour timeframe, Ethereum has slipped slightly below the ascending trendline that guided the recovery throughout July. The break isn't decisive yet, but it signals weakening bullish momentum. If ETH stays below that trendline, a deeper retracement toward the $1.76K to $1.79K demand zone is possible. Reclaiming the trendline and breaking above $1.88K to $1.91K would invalidate the short-term weakness and target $1.95K to $2K.
Liquidity pocket and downside risk
The one-month Binance ETH liquidation heatmap shows a substantial concentration of liquidity around the $1.5K level. If the rally loses momentum, a deeper correction toward that pocket could attract price as leveraged long positions get unwound. The prevailing structure remains constructive, but downside risk hasn't completely disappeared. The next few sessions will tell whether buyers can push through resistance or whether the market needs to reset lower first.