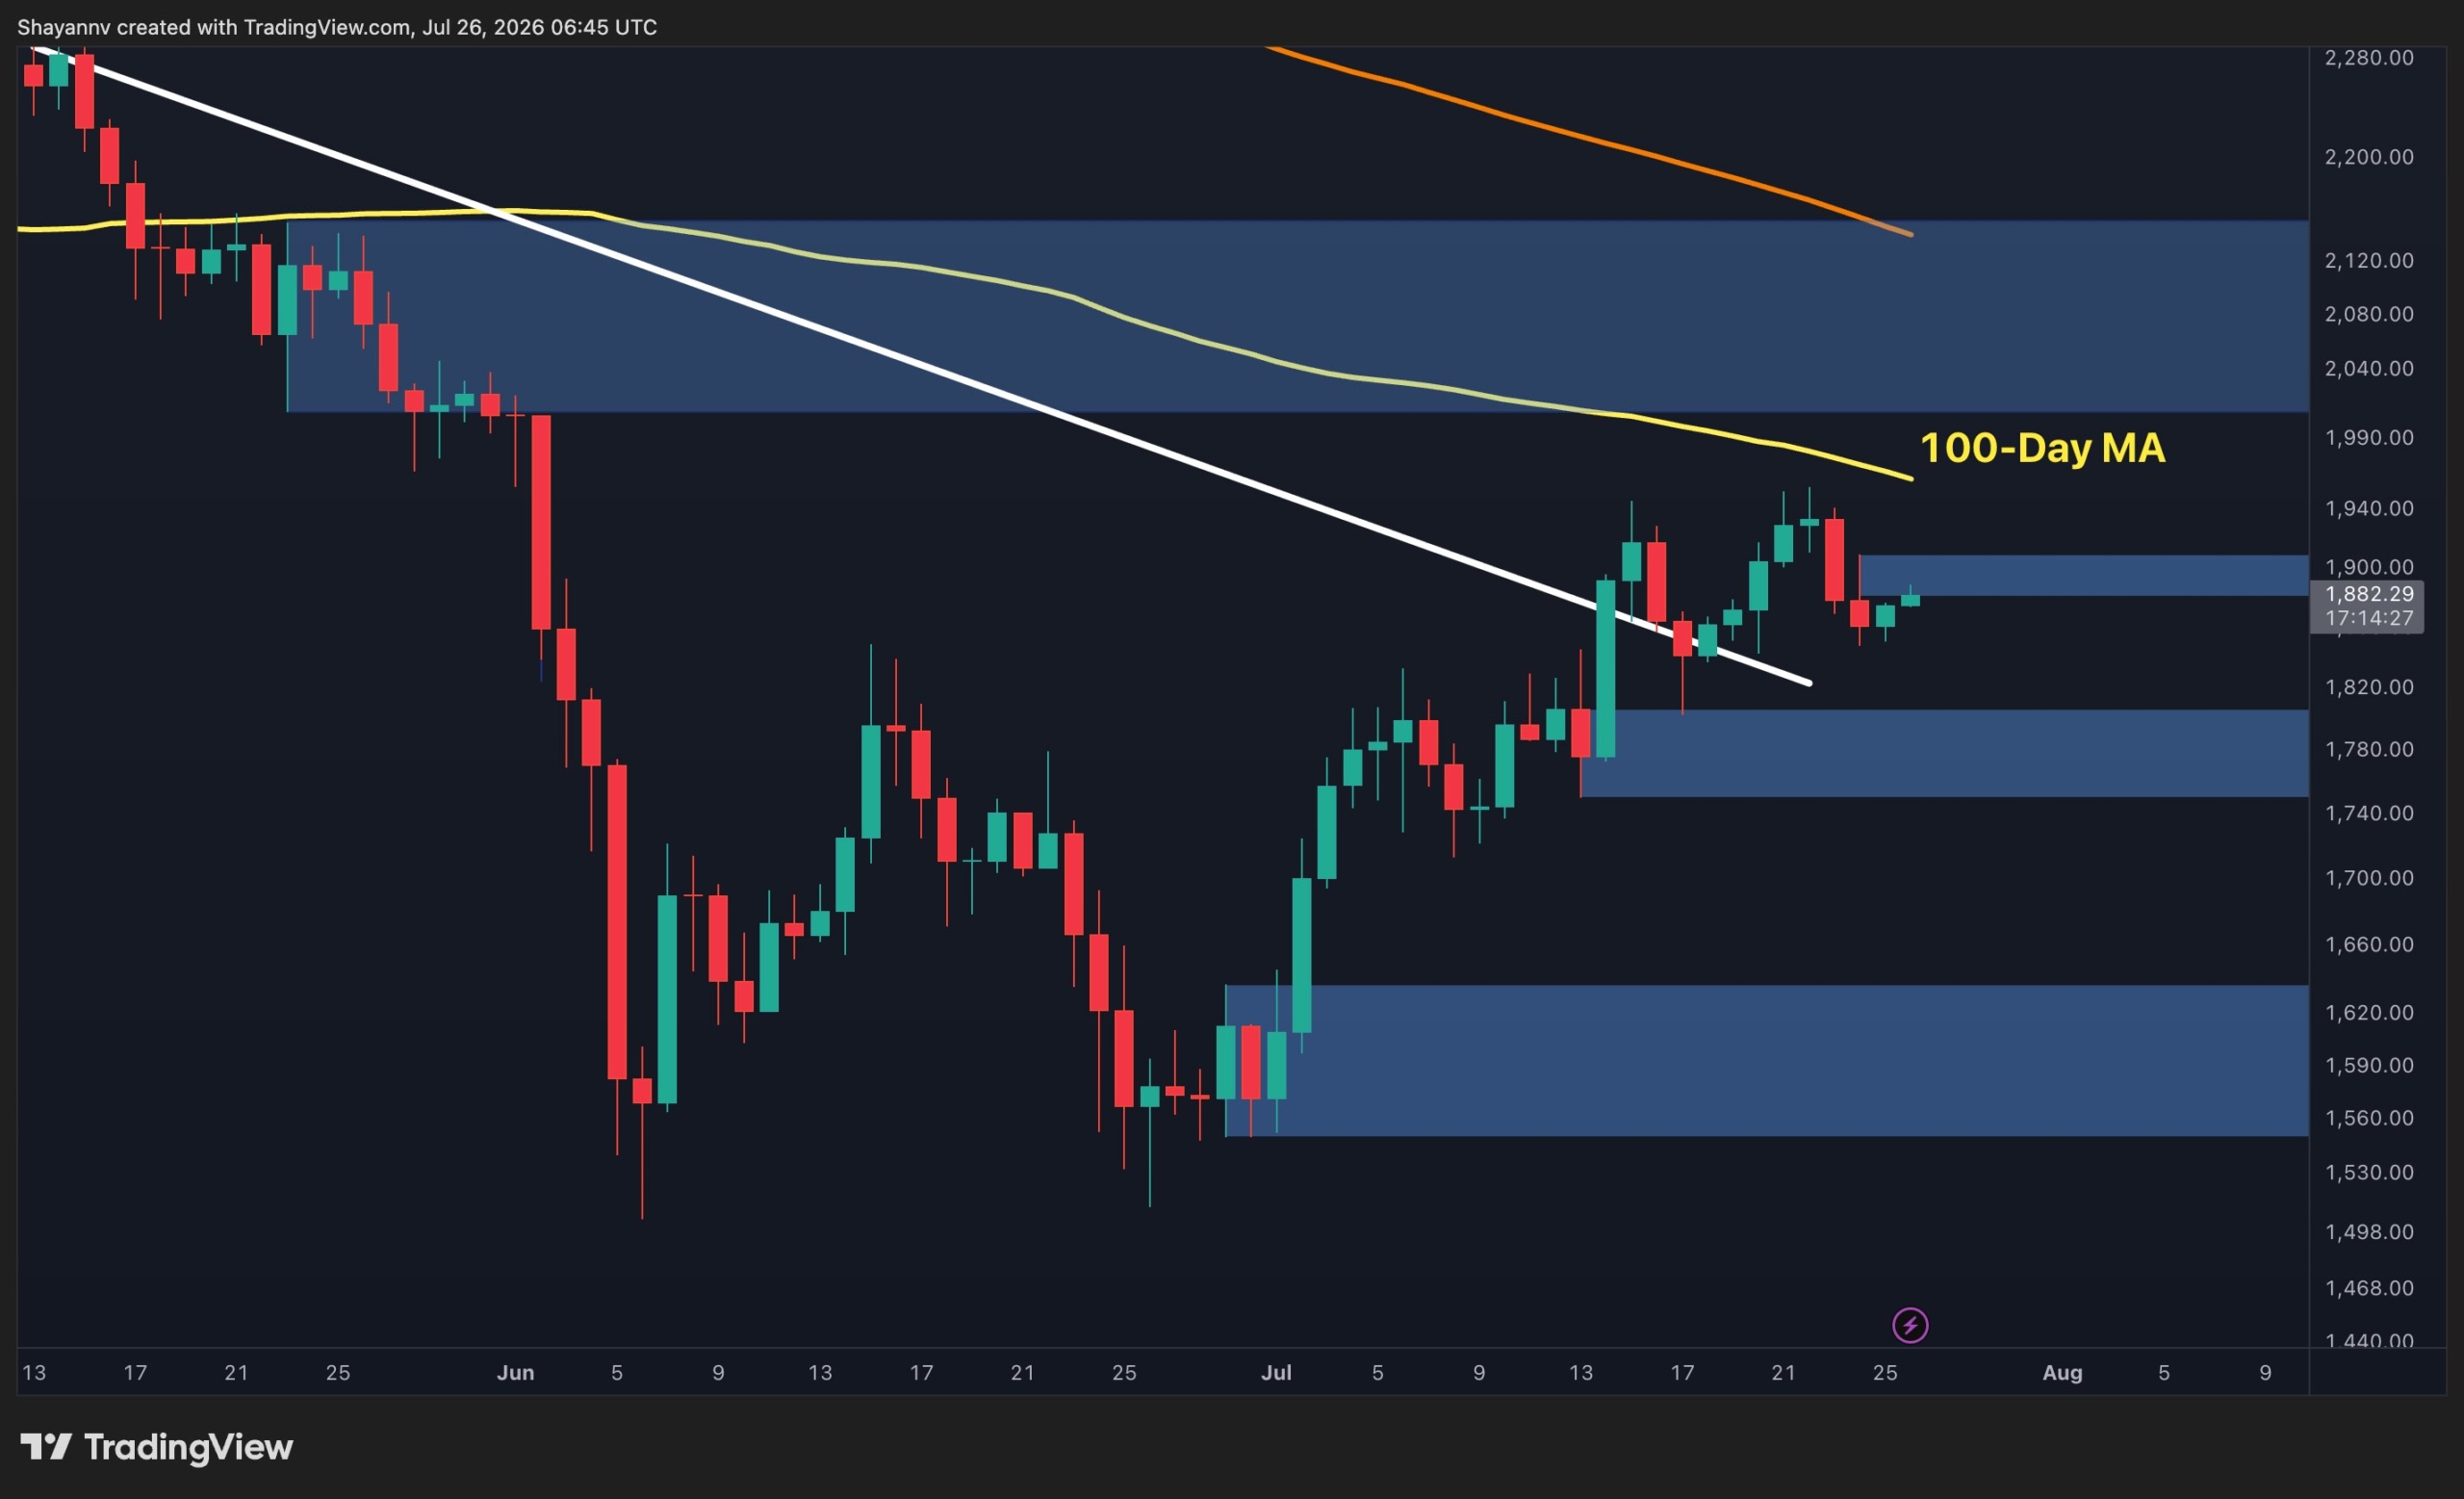
XRP is trading inside a descending channel on the daily chart, a pattern that has dictated its price action for months. The recent bounce from the $1.02 to $1.04 demand zone helped the token recover, but the broader bearish structure remains intact. Now, with the price approaching the upper boundary of the channel, traders are watching whether XRP can break through or will get rejected again.
The Descending Channel Pattern
The descending channel is formed by a series of lower highs and lower lows. XRP has respected both the upper and lower trendlines since the pattern emerged. The latest move saw the price touch the lower boundary near $1.02-$1.04 and rebound. That zone has acted as a reliable support area, attracting buyers each time the token dips there.
On the upside, the main resistance sits at $1.17 to $1.20. This supply zone aligns with the upper trendline of the channel. A successful breakout above that level would signal a potential shift in momentum. If XRP can close decisively above $1.20, the next target is around $1.28, a level that has previously acted as resistance.
Support and Resistance Levels to Watch
If the price fails to break the $1.17-$1.20 resistance, a pullback is likely. The first support area is $1.05 to $1.07. A deeper decline could bring the price back to the $1.02-$1.04 buyers' base, where the last rebound started. That zone has held multiple times, but repeated tests could weaken it.
The descending channel's lower boundary is currently near $1.02. A break below that would be a bearish signal, potentially accelerating losses. However, the recent bounce from that level suggests buyers are still active there.
4-Hour Chart Shows a Failed Breakout
On the shorter timeframe, XRP recently pushed toward the $1.16 to $1.18 resistance zone but failed to secure a breakout. The price was rejected and pulled back. This failure reinforces the importance of the $1.17-$1.20 area on the daily chart.
The 4-hour chart also shows an ascending wedge pattern. The lower trendline of that wedge is now the key support. If XRP breaks below that trendline, downside risk increases significantly. A breakdown would likely lead to a test of the $1.05-$1.07 support region.
What to Watch Next Week
The article suggests XRP could be heading for a major move next week. The converging trendlines of the descending channel mean the price is running out of room. A breakout or breakdown becomes more likely as the channel narrows.
Traders will be watching the $1.17-$1.20 resistance closely. A clean break above that level, especially on high volume, could trigger a rally toward $1.28. On the flip side, a rejection from that zone would put the $1.05-$1.07 support back in play. A break below $1.02 would confirm a bearish continuation.
For now, XRP remains in a holding pattern. The next few days will determine whether the bulls can push through resistance or the bears regain control.