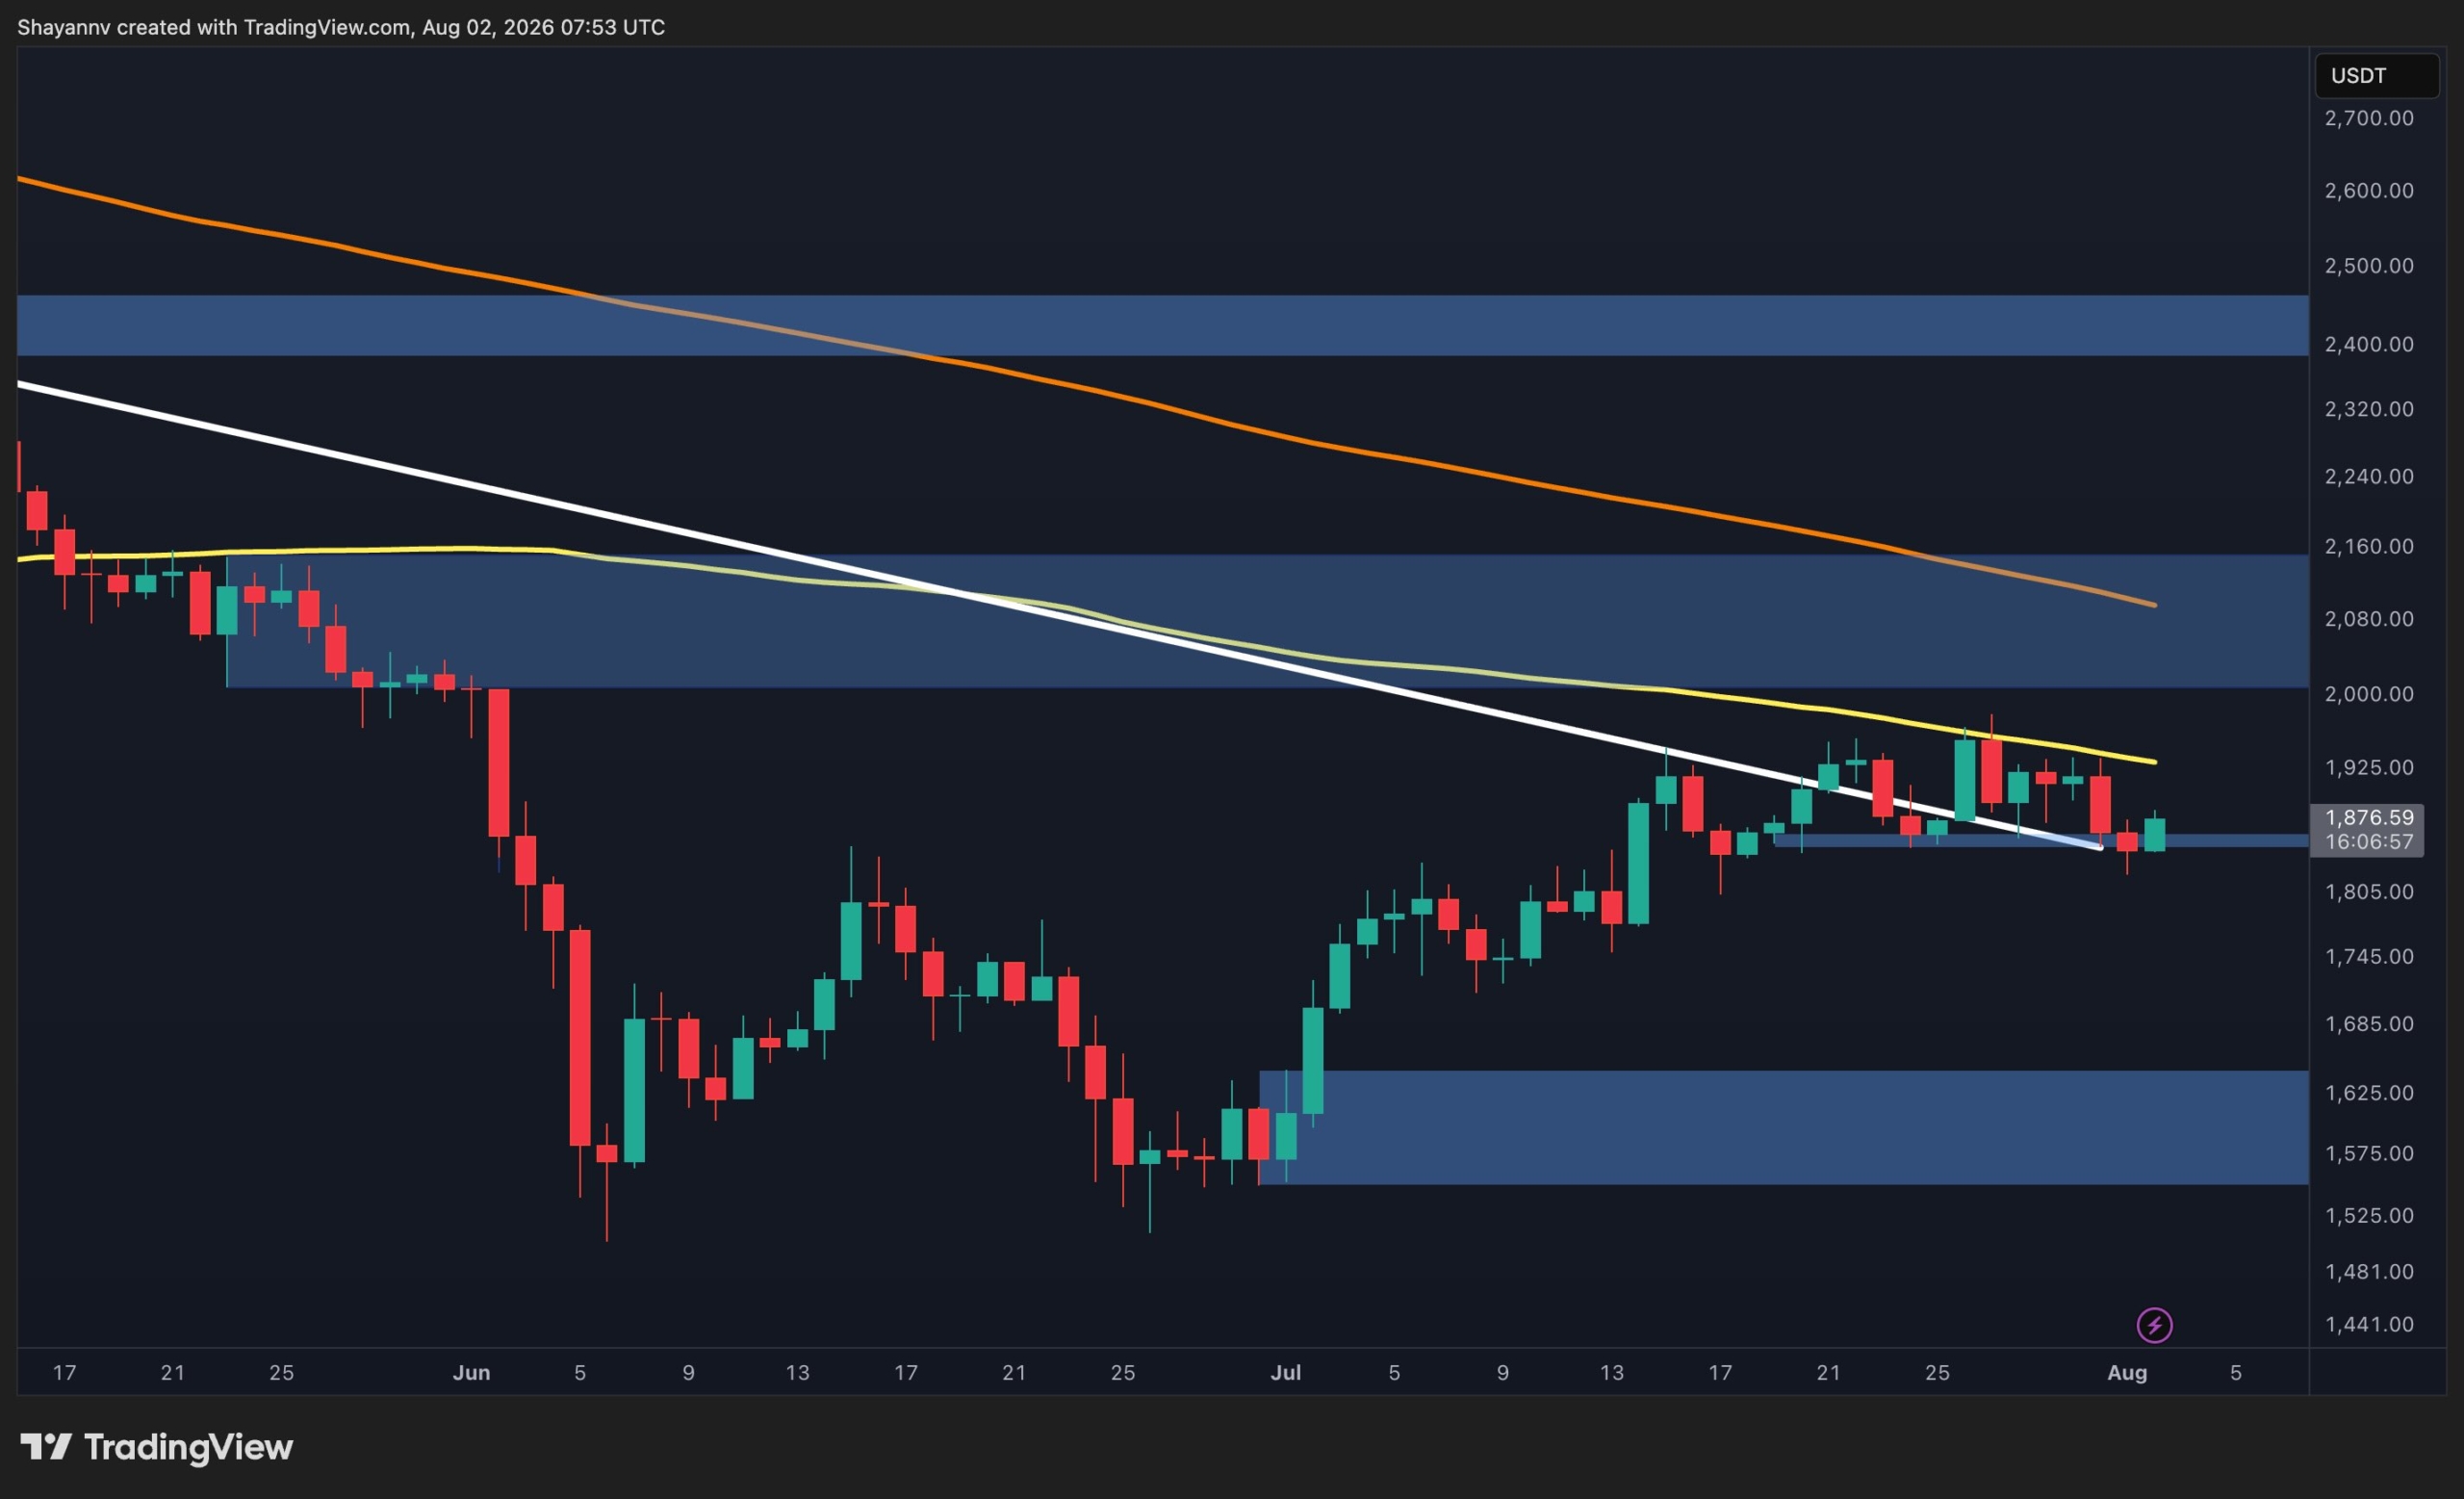
A classic oversold signal is flashing for PEPE, with the token's Relative Strength Index dropping to 18.73 — deep in territory that often precedes a sharp reversal. Technical indicators suggest the meme coin could rally 27-99% over the next 30 days, targeting a price range of $0.0000035 to $0.0000055 by July.
RSI at an Extreme Low
The Relative Strength Index measures how quickly prices are changing. A reading below 30 typically means an asset is oversold. At 18.73, PEPE is far past that threshold. The last time the RSI hit this level, the token rebounded more than 60% within two weeks. Traders watching the metric see it as a strong buy signal, though no one is guaranteeing the pattern will repeat.
Bollinger Band Pinch Points to Volatility
PEPE is also trading well below its Bollinger Band baseline — the middle line that represents a simple moving average. When price pushes under the lower band the way PEPE has, it often snaps back toward the mean. The squeeze between the bands suggests volatility is about to increase, and the direction historically has been up in similar setups for this asset.
The 30-Day Target Window
Technical projections peg the bounce to reach between $0.0000035 and $0.0000055 within the next month. That's a wide range — the lower end is a 27% gain from current levels, the upper end nearly a double. The forecast runs through July, giving traders a concrete timeline to watch. Whether the move materializes depends on broader market conditions and whether the oversold reading draws enough buying pressure.
The next few weeks will tell if the technicals play out as predicted.