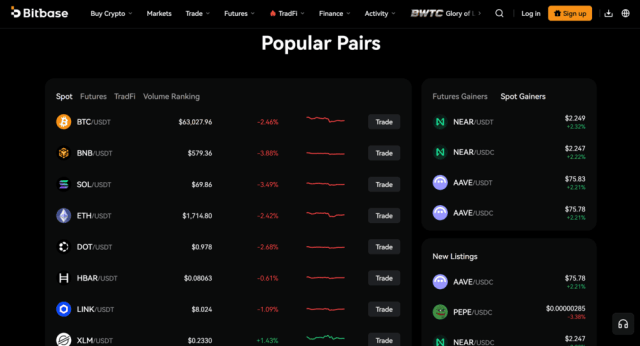
PEPE fell nearly 4% in the last 24 hours, with technical indicators pointing to continued bearish momentum. The token is pressing against its lower Bollinger Band while stochastics show oversold conditions.
Technical Indicators Point to Weakness
The price action over the past day has been one-sided. Sellers have kept control, pushing PEPE toward the lower boundary of its Bollinger Bands. That band marks a level where the price has historically been considered low relative to recent volatility — but it doesn't guarantee a reversal. Right now the token is hugging that line, a position that often signals persistent downward pressure.
Meanwhile, the stochastic oscillator has sunk deep into oversold territory. That reading typically suggests the asset is due for a bounce, but in a strong downtrend, oversold conditions can persist for days. No immediate relief is baked into the numbers yet.
What the Oversold Reading Means
Oversold stochastics are a common sight during sharp sell-offs. They measure momentum and tell traders that the selling has been unusually intense relative to recent price ranges. When stochastics dip below 20, as they have for PEPE, it indicates that the token is trading near the low end of its recent price range. Some traders view this as a buy signal, betting on a snap-back. Others see it as a warning that the trend is still pointing down and that catching a falling knife is risky.
The combination of a lower Bollinger Band press and oversold stochastics creates a split picture: a potential bounce zone on one side, but no confirming signs of buying interest on the other. Volume data isn't part of the current technical picture, but the price itself tells a straightforward story — sellers are in charge.
Where PEPE Traders Are Looking Next
With no major support level mentioned in the data, the immediate focus for traders is whether PEPE can hold near its current price or break lower. The lower Bollinger Band often acts as a technical floor, but it's a dynamic level that can shift as volatility changes. If the band starts to slope downward, it would reinforce the bearish view.
The oversold reading hasn't triggered a meaningful bounce so far. That leaves the next few trading sessions as a test: either buyers step in to defend the current zone, or the sell-off deepens. For now, PEPE's price action is a textbook example of a bearish trend in progress, with technical indicators offering more caution than hope.